
The Future Homeownership Report
Posted in: Moving AdviceWhat income do Americans need to afford a home in 2030?
Key Findings
- By 2030, home prices are projected to outpace income growth in all 50 states, with a national median of $615,103.
- In California, the income needed to afford a home could exceed $250K annually, higher than any other state.
- 8 out of 50 states will need to see their household income double in 5 years to make predicted house prices affordable.
- Irvine, CA has the highest predicted house prices in 2030 of almost $3 million, needing a minimum household income of $589,862.
- Montana, California and Idaho are among several Western states that are poised to become completely unaffordable for median earners.
The Bottom Line: Many Americans are being priced out of homes due to increasing property costs and stagnating wages.
In 2025, the U.S. housing market is expected to remain largely frozen with limited growth, according to a J.P. Morgan report. The report also cites other challenges facing potential homeowners and movers, such as rising house costs, stagnant wage growth, and even recent governmental policies on immigration and tariffs set to affect housing affordability.
“Among the top ten [metros], there are some cities where the gap exceeds 500%, while others require residents to earn over $500K as a household to afford the median 2030 home price.”
To find out where Americans may be priced out of property in the future, we created a 5-year projection which analyzed the historical progression of house prices and household income for each city and state in the U.S. By looking at how these rates increase from 2025 to 2030, we identified where residents might not be able to afford to buy a home in the future. Some states, such as Montana, will see their household income needing to increase by up to 144% for residents to afford a home in 2030, while other metro hotspots are experiencing projections as high as 517%.
Table of Contents
- States With the Largest Projected Affordability Gaps by 2030
- Full Home Affordability Ranking for All 50 States
- Least Affordable Cities for 2030 Homeownership in the Nation
- Full Home Affordability Ranking for the Top 100 Cities in the U.S.
- What This Means for Renters and First-Time Buyers
- Full Methodology
What We Did
To help Americans find out where they’ll be able to afford in 5 years’ time, HireAHelper has analyzed Redfin’s data center to calculate projected median home prices in each state by 2030 using historical growth rates. We then calculated the minimum income needed to afford a home, factoring in mortgage payments, taxes, and insurance, and compared it to current median household incomes to determine the affordability gap.
Montana Faces the Fastest-Widening Homeownership Affordability Gap in the U.S.
As home prices continue to rise faster than wages, the gap between what households earn and what they need to afford a home is widening. This growing disparity varies by state, revealing where residents may face the greatest challenges to homeownership by 2030.
The current median house price in the U.S. is $431,000, which is predicted to rise to $615,103 by 2030. If an American buyer put down 20%, the down payment would be $123,020, with annual property costs of $37,323. To afford this, households would need to earn a minimum of $111,970, a 44% increase of the current median household income.
Homeowners can use the chart below to find out which states they’ll likely be priced out of in the future and which states perhaps provide a better long-term deal:
Top 10 States With the Largest Projected Affordability Gaps by 2030
Montana topped the ranking with residents needing a 144% increase in income to afford a home by 2030, followed by California with a 140% increase and New York with a 103% increase.

Methodology: To find the states with the widest projected housing affordability gaps by 2030, HireAHelper analyzed historic house price data to calculate each state’s historical 5-year compound annual growth rate in home prices and projected this forward to estimate 2030 prices.
How Much Will Buyers’ Income Need to Increase in Each State to Afford a Home by 2030
1. Montana: 144%
Montana is projected to be the least affordable state for homeownership in 2030. To keep up with rising house prices, household income would need to increase by 144.09%. With median home prices expected to hit $932,584 and annual property costs reaching $63,582, residents would need to earn over $190,746 per year to afford a home.
2. California: 140%
Soaring house prices in California have long outpaced its already high salaries, but the gap is still widening. The data shows that household income would have to increase by 139.83% to $251,989 a year, more than double the national median. In 2030, predicted house prices are likely to reach an alarming median of $1,239,280, higher than any other state.
3. New York: 103%
New York has long attracted homebuyers with its strong job market and rising wages, but by 2030, this might not be enough. To afford a home, median household income would need to increase by 102.82%, as median home prices are projected to hit $781,203, and annual property costs are projected to climb to $59,901.
4. Rhode Island: 100%
In just 5 years, household income in the state of Rhode Island will have to increase by 99.48% for residents to be able to afford the predicted house price rise to $854,760. This means that prospective homeowners in this state will need a combined income of $189,445 to cover the $63,148 yearly costs.
5. New Jersey: 95%
Although New Jersey is predicted to have the 9th most expensive median house price in the country by 2030 of $844,849, the state will need the second-highest household income to afford it. With annual property costs, including mortgage and taxes, expected to exceed $70,104, households will need to earn $210,313, a 94.61% increase from current income levels, just to keep up.
6. New Hampshire: 83%
By 2030, the median home price in New Hampshire is projected to reach $832,779, pushing annual property costs to $65,272. To afford this, residents would need a minimum household income of $195,816, a 82.55% increase from current income levels — effectively more than doubling what households earn today.
7. Utah: 82%
Utah sees the second-highest predicted house prices of any other state, trailing only California. The $958,405 median house price prediction is just shy of the $1 million mark, meaning that residents would need a minimum household income of $189,702 to afford a home, more than double the current state median.
8. Idaho: 82%
Median household income will have to increase by 82.09% in Idaho for residents to be able to afford the median cost of a home in 2030. House prices are predicted to rise to $776,961 in 5 years, hiking the yearly property costs in the area to $51,262. Homeowners will then need a minimum household income of $153,788 to keep up with property costs.
9. Wyoming: 81%
In 5 years, median home prices in Wyoming are projected to reach $702,771, driving annual property costs to $46,719. To keep pace, households would need to earn at least $140,157, an 81.40% increase from current income levels.
10. Washington: 79%
By 2030, the median home price in Washington is expected to surpass $900,487, making it the fifth-most expensive state in the country. For those buying a home, this means that their median household income would need to be at least $186,612, a 78.87% increase on current income levels.
“The current median house price in the U.S. is $431,000, which is predicted to rise to $615,103 by 2030. If an American buyer put down 20%, the down payment would be $123,020, with annual property costs of $37,323.”
Residents of these states will see an increasing risk of being priced out of the housing market as home values continue to climb faster than local incomes. In many cases, long-term housing booms have driven up prices beyond what the median household can afford, while wage growth has not increased at the same rate.
This growing imbalance means that even residents with stable employment may struggle to save for a down payment or qualify for a mortgage, putting homeownership further out of reach and deepening affordability challenges across the U.S.
Full Home Affordability Ranking for All 50 States
While many states are seeing large predicted increases in home prices, and therefore the household income needed to keep up, not all states are seeing the same pressure.
This is the case in North Dakota, Louisiana, and Iowa, where household income doesn’t need to increase at all for residents to be able to afford the median house price of $342,912, $296,160, and $327,422, respectively.
Use the map below to find out how much your household income would need to grow by 2030 to be able to afford a home in your state.
The States Where Homeownership Will Be Most Out of Reach by 2030
Montana topped the ranking with residents needing a 144.09% increase in income to afford a home by 2030, whereas states like North Dakota, Louisiana, and Iowa showed no increase in income needed, making homeownership far more attainable.
Methodology: To find the states with the largest projected housing affordability gaps by 2030, HireAHelper analyzed historic house price data to calculate each state’s historical 5-year compound annual growth rate in home prices and projected this forward to estimate 2030 prices.
6 of America’s Least Affordable Cities for Homeownership Will Be in California by 2030
Which cities will see the largest homeownership affordability gap by 2030?
Alongside looking at the states where residents will be priced out of buying a home in 2030, the data also used city-level metrics to discover the U.S. cities that have the largest homeownership gap.
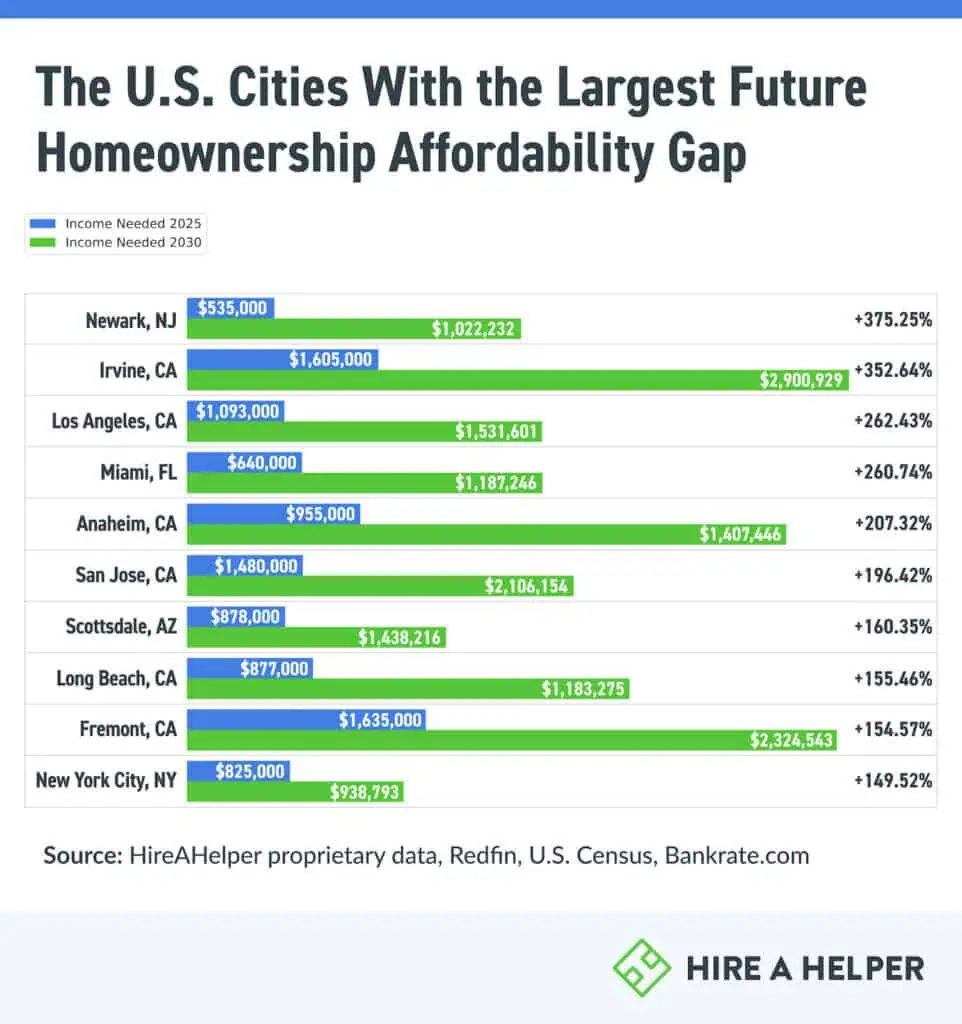
Among the top ten, there are some cities where the gap exceeds 500%, while others require residents to earn over $500K as a household to afford the median 2030 home price.
Here’s a closer look at the 10 cities facing the largest homeownership gaps in the years ahead.
The U.S. Cities With the Largest Future Homeownership Affordability Gap
Irvine, CA topped the ranking with residents needing a 517.52% increase to afford a home in the city by 2030, followed by Fremont, CA with a 394.83% increase and San Jose, CA with a 348.34% increase.
Methodology: To find the cities with the largest projected housing affordability gaps by 2030, HireAHelper analyzed historic house price data to calculate each city’s historical 5-year compound annual growth rate in home prices and projected this forward to estimate 2030 prices.
How Much More Will Buyers in Each City Need to Earn to Afford a Home by 2030
1. Irvine, CA: 518%
The city in the U.S. where homeownership will be most out of reach in 2030 is Irvine, California, where the gap between projected property prices and household income is a staggering 517.52%. House prices in the area are set to become the most expensive in the country, at a median of $2,900,929, with a downpayment of 20% alone hitting $580,185 That’s nearly the same cost of an average home elsewhere in the U.S.
2. Fremont, CA: 395%
To keep up with rising property costs, residents in Fremont, California will need to earn more than $472,662 annually to afford a home in 2030. This affordability gap is largely driven by Fremont’s proximity to Silicon Valley, a tech hub that continues to drive high demand for housing.
3. San Jose, CA: 348%
As the global center of technology, San Jose will see households need to triple their income in just 5 years to be able to afford the projected 2030 house prices of $2,106,154. To keep up with the expected $142,752 in annual property costs, households will need to earn at least $428,256, a 348.34% increase from current levels.
4. Scottsdale, AZ: 268%
By 2030, Scottsdale’s housing market is expected to become one of the most expensive in the nation, with median home prices surpassing $1,438,216. To afford a home at this price point, residents will need a minimum household income of $284,242, reflecting a 267.64% increase from current income levels.
5. Miami, FL: 231%
Long known as one of the most expensive places in the world to live, Miami’s housing market is set to become even more out of reach. Residents will need a 230.75% increase in household income to match increasing property prices. By 2030, median house prices are expected to hit $1,187,246, meaning the minimum household income to afford a home would need to be around $242,477.
6. Los Angeles, CA: 226%
The second-most populated city in the U.S., Los Angeles is projected to see median home prices climb to $1,531,601 in 5 years. To afford the estimated $103,809 in annual property costs, households would need to earn at least $311,429, a 226.03% increase from current income levels. This growing affordability gap is fueled by limited housing supply, high demand, and persistently slow wage growth.
7. Anaheim, CA: 200%
In the heart of Orange County and home to Disneyland Resort, Anaheim’s housing market is set to become significantly less accessible. By 2030, median home prices are expected to reach $1,407,446, requiring a $281,489 down payment and $95,394 in annual property costs. To afford this, households would need to earn at least $286,183, a 199.60% increase from today’s median income.
8. San Francisco, CA: 194%
In 5 years, household income in the city of San Francisco, California, will have to increase by 193.59% for residents to be able to afford the predicted house price of $1,379,207. This means those looking to buy a house or move to the city will need a combined income of $280,441 to cover the $93,480 annual property costs.
9. Plano, TX: 163%
The residents of the second southern city on our list, Plano, will need a 168% increase in household income to afford an average home in 5 years. House prices are set to shoot up to $869,253 by 2030, and while this isn’t as expensive as some other cities, household income will need to exceed $199,437 to match this increase.
10. New York City, NY: 163%
As the largest city in the U.S. and one of the most desirable places to live in the world, New York City’s housing market is set to become even more expensive by 2030. With median home prices expected to surpass $938,793, residents will need to increase their household income by 163.06%, reaching $215,955 just to keep up with rising property costs.
Full Home Affordability Ranking for the Top 100 Cities in the U.S.
Below is a full ranking of the 100 most populated cities in the U.S., detailing those with the largest homeownership affordability gaps by 2030. The analysis includes projected home prices and the required household income to afford a home in each city.
Final Thoughts: What This Means for Renters and First-Time Buyers
The data uncovers a worrying trend for renters and first-time buyers, that many of the states and major metro areas are increasingly becoming out of reach for homeownership with current wages. Without significant policy change, this gap will only deepen, reshaping where and how people live.
Nicolas Graham, General Manager of HireAHelper, provides insight into how these economic pressures are already influencing moving decisions and what future homebuyers can do to navigate such a challenging market.
“As housing prices continue to rise faster than wages, more Americans have to move to reach the American dream of owning a home. We’re no longer just seeing people relocate for jobs or lifestyle, but out of necessity — seeking affordable housing in entirely new places.
This shift is expected to accelerate, with many leaving high-cost urban hubs for more affordable suburbs, smaller towns, or even rural areas. For those renters hoping to become homeowners by 2030, it’s important to start planning now and choosing a location where your income has a better chance of keeping pace with the cost of living.”
Methodology
To find out how much a median house could cost in each U.S. state based on the last 5 years of growth (assuming it continues for the next 5 years) HireAHelper used Redfin‘s data center to look at the current median sale price in each state, and then the median sale price 5 years ago. We then calculated the compound annual growth rate over the last 5 years, and applied this rate to the next 5 years to reveal how prices could potentially look by 2030.
To look at the affordability of these potential prices in 5 years time, we then calculated mortgage costs using Bankrate’s mortgage calculator, and assumed that a person buying the home would have a 20% deposit, a 30 year term, and that the interest rate was still the average of 6.5%. We then took current property tax rates and applied these to the annual cost of owning the property. Please note that the annual figures do not take into account other expenses such as home owners insurance, any debts, or HOA fees.
We then used the 28/30 theory, in that your housing costs should be no more than a third of your annual household income, to reveal the minimum household income that would be needed in each state to afford the projected median house price.
Lastly, we then pulled the most recent figures from the Census on household income in each state. We then looked at how much household income would need to increase in each state to be able to afford a median home in each state.