Key Findings
- 4 in 10 (43%) Americans who began college in 2020 moved away from home, the highest rate since 2005
- Nationwide, roughly 31% of all college students have left their home state to attend college
- In 39 out of 50 states, more students attend college within their home state than attend out-of-state universities
- Californians (17%) and Texans (20%) among least likely to go to college out-of-state
- People from New Hampshire are most likely to study out-of-state (75%)
- With exception of Washington D.C., institutions with the biggest out-of-state admissions are Dartmouth College (98%), Brown (95%), Yale (93%), MIT (93%), Notre Dame (92%), John Hopkins (90%)
- Average distance traveled by a student to study in a top 200 college is 293 miles
- Schools with the farthest pull are CalTech, MIT, and Stanford—students avg. more than 1,000 miles to attend
Over two million people enrolled in colleges and universities in the fall of 2020. While that figure represents a 13% decline compared to enrollment in 2019, the total percentage of newly enrolled students who relocated to go to college last year was 43%. That’s a five-year high!
In light of that figure, we broke down college relocation data to find out where Americans are moving to attend college, as well as how likely they are to move out-of-state in pursuit of a college degree.
We also compare schools by how many out-of-state students they attract (and more!) to determine which top-ranked colleges have the greatest pull by admission among applicants across the United States.
Fewer Americans Are Going to College, but More Are Moving To Pursue Higher Education
Given the kind of year 2020 had been, it’s hardly surprising that fewer Americans enrolled in higher education than in the year prior, likely due to student debt concerns. According to the figures out of National Student Clearinghouse, just over 2.1 million people started college in the fall of 2020, 13% fewer than in the fall of 2019.
And yet, based on the internal migration estimates by the U.S. Census Bureau, 938,000 Americans, or 43% of all who enrolled, chose to move to attend college last year. The out-of-state attendance number for 2020 is the highest rate the U.S. has seen since 2005, a year when half of all college freshmen left home to pursue education.
Moving far away?
Do it cheaper.
HireAHelper.com can save you up to 40%, compared to traditional interstate van lines.
Compare our long distance moving company options.
Brain Drain? States College Students Are Most (and Least) Likely To Leave
With so many newly admitted students moving to college, how far are they moving? Are most of them staying in their home state, or are they crossing state lines in pursuit of higher education?
“The out-of-state attendance number for 2020 is the highest rate the U.S. has seen since 2005…”
Reasons to study in-state are plentiful: remain closer to family, save big money on tuition, or just because great schools are already in your home state.
In fact, the data show 69% of college students who move to go to college actually stay in their state. This is especially true in states like Texas, Mississippi, California, and New Mexico, states where more than 80% of college students have chosen to study closer to home.
On the flip side, nearly a third (31%) of all newly admitted students relocated to a different state to go to college in 2020.
The share of those who are prepared to travel far for a degree is especially high in remote states like Alaska and Hawaii, as well as small states within the New England area, such as New Hampshire, Rhode Island, and Connecticut.
| State | % of students leaving state | State | % of students leaving state | |
| New Hampshire | 75% | Delaware | 9% | |
| Alaska | 74% | Mississippi | 14% | |
| District of Columbia | 71% | California | 17% | |
| Rhode Island | 69% | New Mexico | 18% | |
| Connecticut | 64% | Texas | 20% | |
| Hawaii | 61% | North Carolina | 21% | |
| Vermont | 60% | Wisconsin | 24% | |
| Nevada | 59% | Ohio | 24% | |
| Maryland | 55% | Tennessee | 24% | |
| North Dakota | 53% | Kentucky | 25% |
Where are all these students moving to? For the most part, students who decide to go to college in a different state head for states known for their great schools, as well as big cities with ample job opportunities.
Almost 1 in 10 (9%) students who attend college out-of-state study in California, the most of any state. Meanwhile, Florida, Illinois, and New York each attract 5-6% of traveling scholars. Notably, Massachusetts, renowned for being home to some of the best schools in the county, receives 4% of all out-of-state college moves.
In all, roughly one in three (30%) students that went to college out-of-state moved to one of these previous five states.
The Colleges With Highest Percentage of Out-of-state Students
Moving for college, of course, is much more about the college than the city or state it’s in. Which colleges in the United States attract the most students from outside their states? We looked at the top 200 colleges and universities listed in the 2021 U.S. News National Universities Ranking and looked up their corresponding 2019 admissions stats from the National Center for Education Statistics. Here’s what we found out.
There are a handful of universities where 98% of freshmen come from out-of-state, and most of them are in Washington D.C. This is hardly surprising, given how small the District of Columbia is, both in area and population.
Yet besides D.C.-based colleges, the highest rates of out-of-state admissions belong to Ivy League schools Dartmouth (97%), Brown (96%), and Yale (93%).
That said, a few schools outside the Ivy League are so popular nationwide that greater than 90% of their new students move from other states. These schools are:
- Massachusetts Institute of Technology (MIT), with some of the best technical degree programs in the country
- University of Notre Dame, with all-around great academics and a famous college football team
- Johns Hopkins University, known for their excellent medical school
Magnet Schools: Colleges with the Farthest Pull
 Out-of-state admission is a decent measure of how much of a pull a given college has, but it doesn’t give us the full picture. Some schools may feature a high percentage of out-of-state students, but that number may be inflated by attraction from nearby states.
To estimate the true “pull” of America’s top schools, we looked at the origin states of all new students beginning college in 2019 (latest data available) and calculated roughly how many miles an average freshman has traveled to study there.
The answer? The average distance of a college move for the top 200 schools in America is 293 miles.
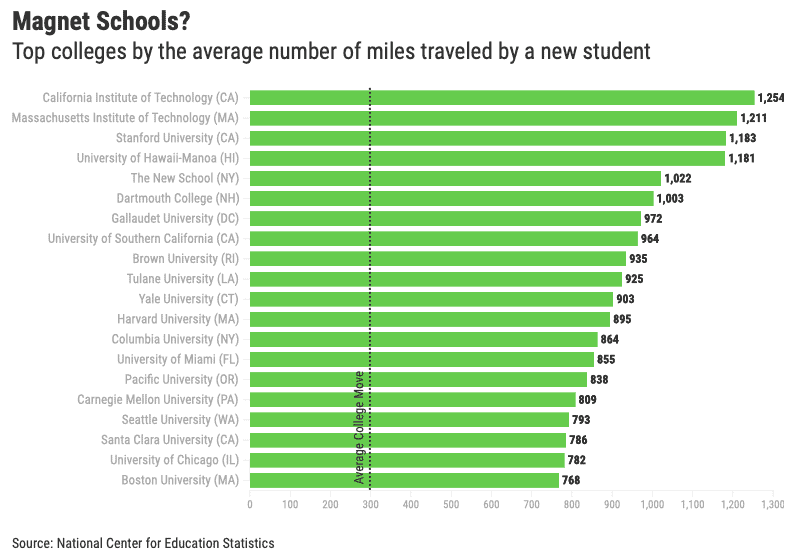
The three colleges for which an average new student had to travel the farthest are schools famous for their programs in STEM and computer sciences: California Institute of Technology (CalTech), MIT, and Stanford University. All three average over 1,100 miles traveled by out-of-staters.
To illustrate how far that is, sitting behind these colleges in average distance traveled is the University of Hawaii-Manoa, which is 3,758 miles away from the rest of the United States and 4,108 miles away from Japan!
For most Ivy League colleges like Harvard, Brown, Yale and Columbia, the number of miles their new students traveled to study there sits around the 900 mile mark.
To find out which school is the biggest draw in your state, check the map below:
Great and Local: Top-Ranked Schools With Mostly Local Students
Despite a high percentage of admissions coming from out-of-state students for top colleges, not all great universities rely as heavily on out-of-state tuition.
As a testament to the fact that Californians are less likely to leave their state to go to college, schools within the University of California system (all ranked within the top 100 of the 2021 U.S. News National Universities Ranking) have a share of out-of-state admissions below 10%.
“…nearly a third (31%) of all newly admitted students relocated to a different state to go to college in 2020.”
Similarly, more than 93% of new students at the University of Texas at Austin, ranked 42nd, hail from Texas. Meanwhile, Rutgers University-New Brunswick, ranked by U.S. News as 63rd in the nation, draws 91% of its admissions coming from its native state of New Jersey.
Other excellent schools for which fewer students cross the country to study at are UNC at Chapel Hill, University of Florida, and the University of Illinois in Urbana-Champaign. The overwhelming majority of new students average around 40 miles of travel to study there.
 Now that we’ve looked at the states, let’s turn to the cities. We looked at ten of the biggest cities across the country to get a sense of just how many people from all over the country and the world they bring together.