How To Move Plants Long Distance

Author:

Publish Date:

Last Modified Date:

Category: Green Moving, Long Distance Moving Advice

Tags: Tags: , , , , , , , , , , , , , , , , , , ,

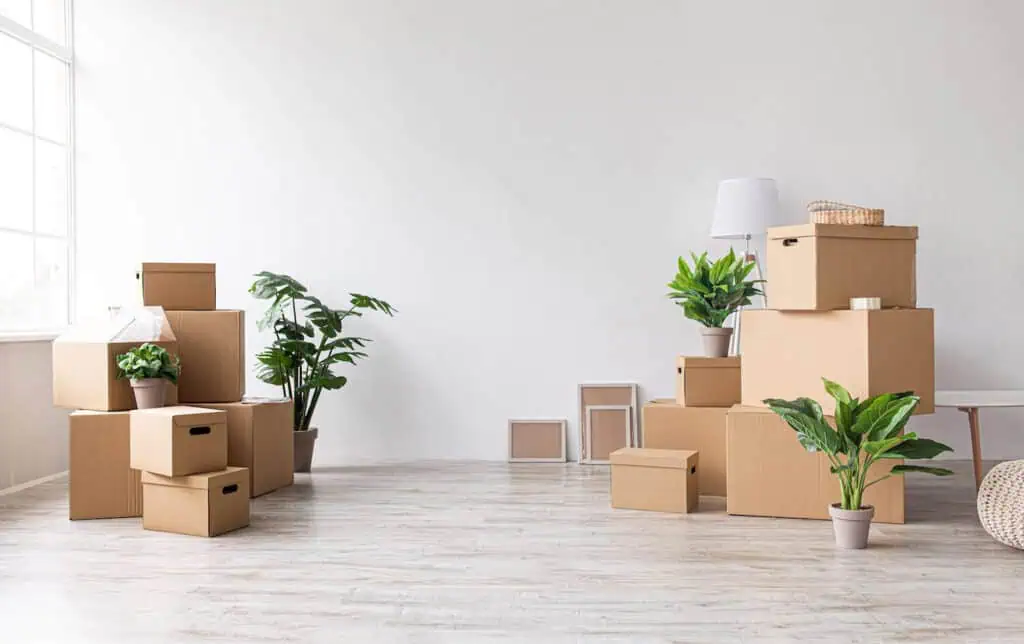
Moving long-distance across the country is already a juggling act. You have to get transportation, find movers, and pack up everything — and then there are your beloved plants to think about. You’ve spent years nurturing that towering monstera deliciosa and tending your English rose garden. At this point, your green friends are basically family! They’ve gotta come with you, right?

The good news is that moving plants cross-country is difficult but doable. And while the task is daunting, it’s possible with the right prep work. Let’s dig (pun intended) into everything you need to know about how to move plants cross-country.

Here’s a quick overview of how to move with plants:

  • Understand legal regulations and moving company rules.
  • Decide which plants to move.
  • Prepare your plants.
  • Choose a transportation method.
  • Pack the plants.
  • Care for plants on arrival.

Know the Rules: Legal & State Regulations

The transportation of plants is carefully regulated in many parts of the United States. The first step in figuring out how to move houseplants all the way across the country is to look into legal restrictions and moving company rules.

Can Movers Move Plants?

Several potted plants sit on top of packed cardboard boxes

Unfortunately, most moving truck and shipping container companies don’t transport plants. Plants are usually not allowed on a moving truck due to certain state laws and possible liability. At the end of the day, it’s just too much of a hassle for the movers to handle living things.

And don’t try to get sneaky and hide your plants among your other belongings, either. Doing so could void your contract with the long-distance movers and would invalidate any protections if the plants lead to a mess that damages your things.

That said, it’s still possible to move your plants long distances. It just requires proper planning and execution.

Moving Plants Cross-Country: The Legal Lowdown

a view of the outside of a Department of Agriculture building

You may not think moving plants across state lines comes with legal pitfalls, but it definitely does.

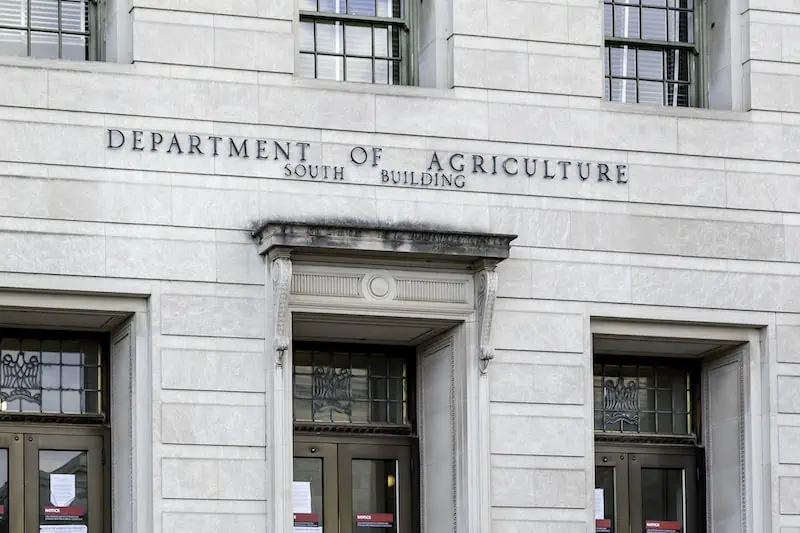
States that rely heavily on agriculture — specifically, California, Texas, and Florida — are very wary of allowing in any pests or invasive species of plants that could destroy crops. Several have strict regulations around bringing in plants from out of state. California, for example, doesn’t allow you to bring any type of citrus plant from another state. Florida also prohibits citrus unless you have a special permit.

The United States Department of Agriculture even bans the transport of certain plant pests, including witchweed. If you really want to know all the rules, you can check out the USDA’s full list of regulated plants within all 50 states and U.S. territories.


“Once it’s time to dig those plants out of your old garden, you’ll want to be careful not to dig too near the base of the plant…[i]nstead, dig a ring around and a bit away from the main stem of your plant…[f]or larger plants, the ring should be at least 6 inches deep.”


Because the rules for each state are different, you’ll need to research which states you’re traveling through and ensure you don’t risk having your plants confiscated at border checkpoints. Some states allow you to bring in plants that exclusively grow indoors, but may require you to repot them with sterile soil before moving. Others may require a certificate of inspection or have you quarantine your plants before bringing them home.

Contact these departments for each state you’re passing through to check for the restrictions, permits, and inspections you may need when moving plants across state lines.

Here are a few best practices for moving plants cross-country, no matter the destination state:

  • Get familiar with the restricted plants list specific to your destination. You can typically find this on the state government website, usually under the local Department of Agriculture branch.
  • Inspect and clean plants to make sure they’re free of pests and soil-borne diseases.
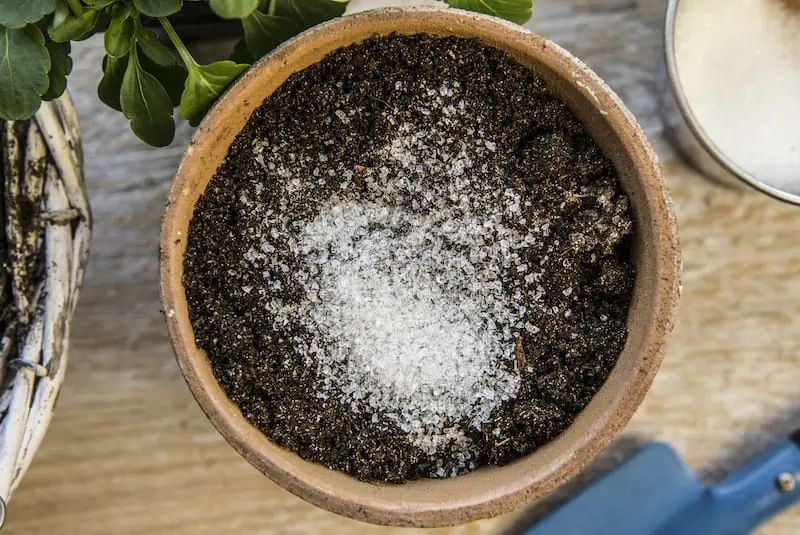
  • Repot plants in new, sterile soil.

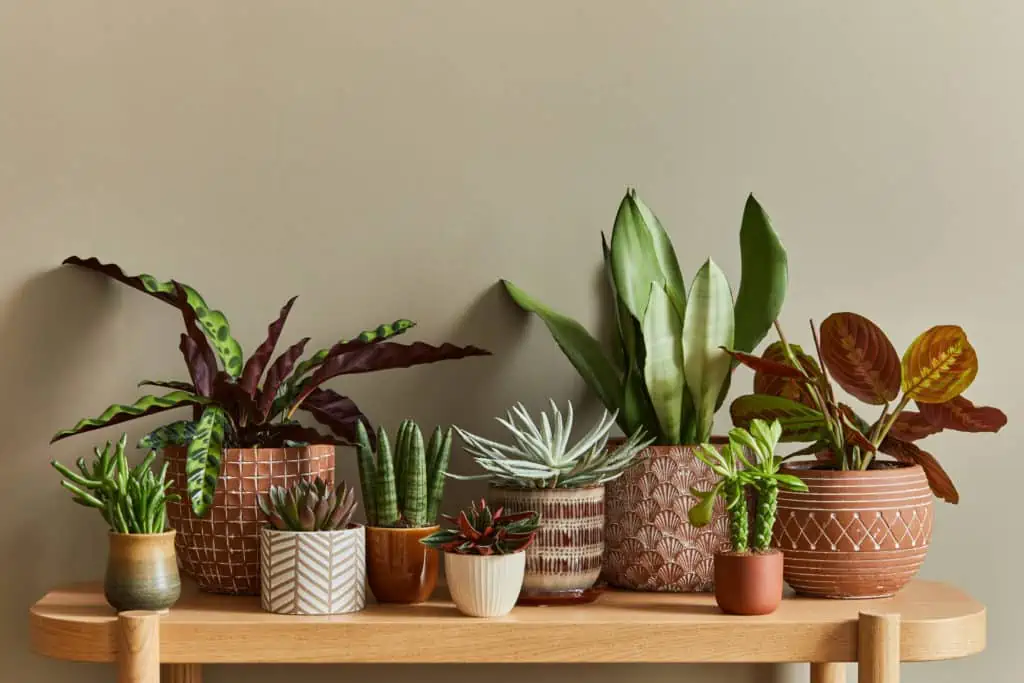
Decide Which Plants Should Make the Trip

moving with plants

Once you figure out which plants you can legally move, it’s time to consider each one individually. After all, not all plants can or should be transported.

Here’s how to decide which plants should come with you to your new home:

  • Check the destination environment. Only move plants that can survive and thrive in your new climate.
  • Think about your new outdoor space. Is there a spot for the plant? Does it have the conditions — shade, sunlight, soil type, etc. — to survive?
  • Evaluate plant age and health. For the best chances of survival, take only hearty and healthy plants. It may sting, but it’s a good idea to leave older or fragile plants behind.
  • Consider the practicalities. Make sure you have the time and space to dig up, pot, and transport plants. It may not be feasible to bring large plants with you.
  • Plan for seasonality. The best time to move plants is during the spring or fall when the weather is mild. If you’re moving in the summer or winter, take only the plants that can withstand extreme temperatures.

What do you do with the plants you can’t bring? No proud plant parent wants to say goodbye to their collection, but that may be what you have to do. Spend some time finding them a good home by donating them to friends and family, users on PlantSwap, or people on sites like Facebook Marketplace.


Prepare Your Plants for the Move

A young woman puts plants into the back of a car

Once you’ve decided which plants are worth taking, it’s time to get them ready. A quick drive across town might not require much more than careful packing, but longer moves need a bit more preparation to keep your plants healthy and safe along the way.

If you’re planning a long-distance move, it’s important to prepare your plants properly:

  • Water your plants a couple of days before the move. This means they’ll be hydrated but not waterlogged for the move. The last thing you want is a sloppy, muddy mess that gets everywhere inside your vehicle.
  • Inspect your plants for pests or dead leaves, and prune them. Doing this will minimize the risks of damage during your move.
  • Nestle smaller plants together in a box in their original planters. Use crumpled paper, dividers, or bubble wrap to prevent them from clinking together or moving around. Wine shipping boxes are also great for this — just be sure to leave the top open for adequate airflow.
  • Use clean, sterilized pots, even if not required by law. This is good practice in general for the health of your plants.
  • Pack fragile plants with plenty of room for airflow. This helps prevent traumatic experiences for your plant.
  • Move larger plants to plastic pots. You’ll reduce weight and potentially avoid broken pots. Want to avoid plastic? Use a lightweight, eco-friendly planter. Consider covering the top of the planter with cardboard or a burlap bag to prevent the soil from spilling when things get jostled around.
  • Transfer your plants to their containers a couple of weeks ahead of the move. You want to give them enough time to adjust to their temporary housing and ensure the moisture level is just right.

How To Move Plants From a Garden

moving a garden

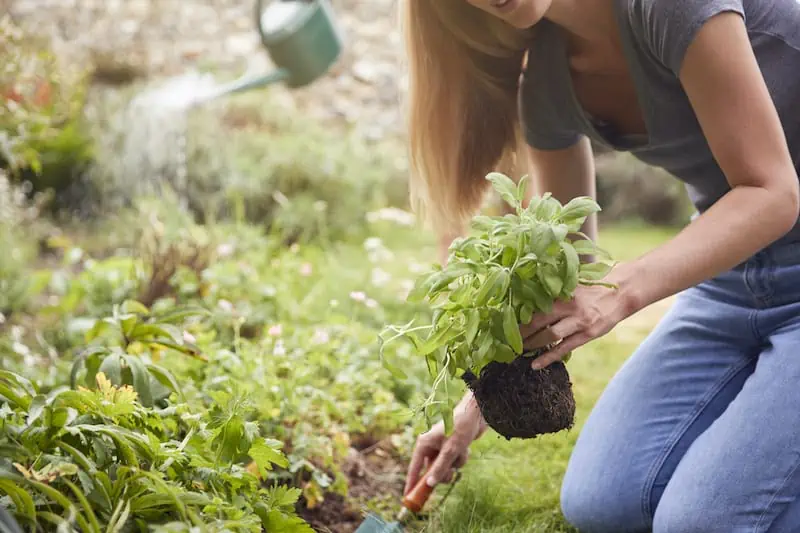
If you’re relocating the plants you’ve grown in your own garden, you’ll need to do a bit of extra legwork. Transferring plants from the ground to containers can be a shock, so it’s important to prepare them for the trip.

Here’s how to prepare garden plants for moving:

  • Allow for several days of generous watering. Be careful not to overwater. Too much water in the soil can prevent plants from soaking up critical oxygen through their roots.
  • Dig around the drip line. Once it’s time to dig those plants out of your old garden, you’ll want to be careful not to dig too near the base of the plant. Tearing or shredding the flesh of the roots is unhealthy for the plant. Instead, dig a ring around and a bit away from the main stem of your plant, carefully paying attention to any roots you may find. For larger plants, the ring should be at least 6 inches deep.
  • Maintain the original soil. Don’t shake or remove any soil from the root ball since this is some of the best protection for your plant during the move.
  • Contain plants correctly. As you dig up and remove each plant from the ground, waste no time transferring them to the pots, buckets, or burlap you’ll be transporting them in. Remember that you’ll need to keep everything adequately watered, so a pot or tub will keep your burlap-wrapped friend from leaking all over your car!

Choose the Right Method of Transportation

Choosing a transportation method is an important part of figuring out how to move plants cross-country. The most common options are:

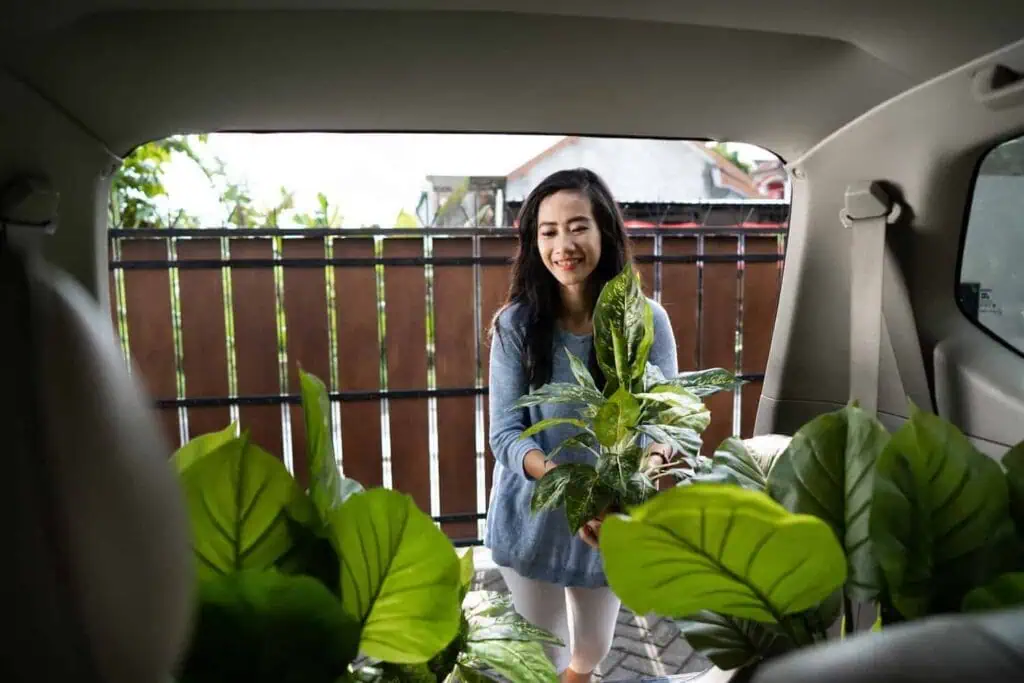
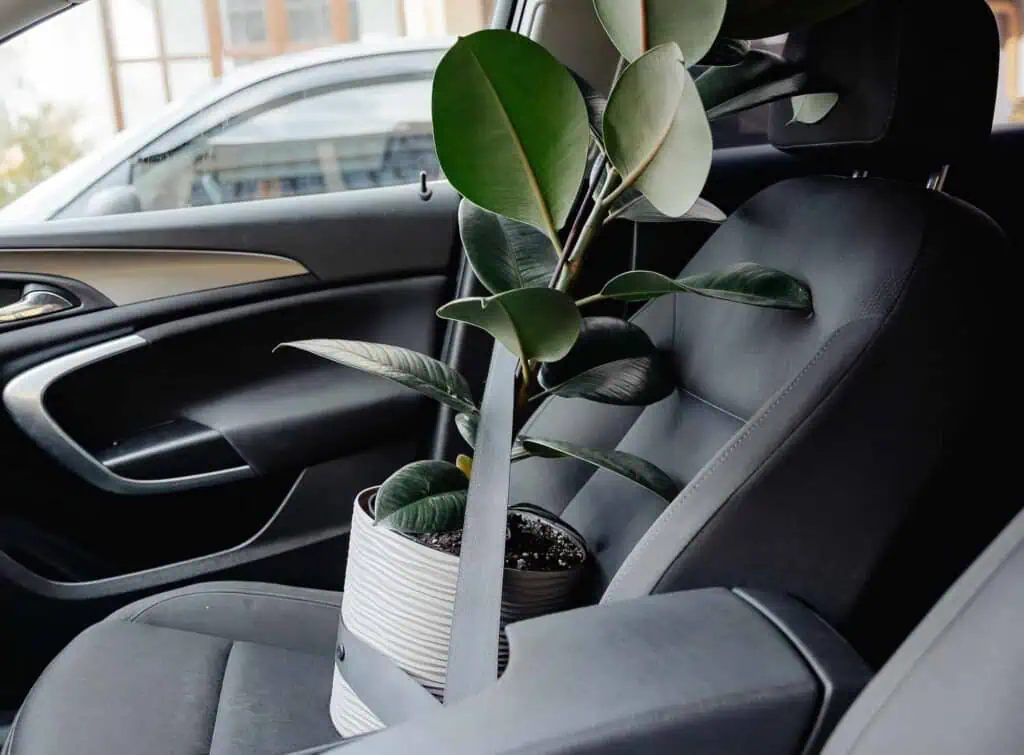
  • Car. Put your plants in boxes, and place them on your car seats.
  • Rental truck. Pack plants into the cab of your moving truck.
  • Mail. It’s a little complicated to learn how to ship plants when moving, but it’s possible as long as you follow the carrier’s rules.
Method Pros Cons
Car  

  • Affordable
  • Easy to control the temperature
  • Easy watering
  • Limited space
  • Potential for a mess
Rental Truck
  • Lots of space
  • No temperature control
  • Possible plant damage due to movement
Mail
  • Saves space
  • Convenient
  • Rules and restrictions
  • Higher cost

Pack Plants Properly

As we stated, moving companies don’t usually transport plants (but it’s worth asking). So, in most scenarios, you’ll be moving them yourself.

How to Prep Plants for Different Vehicles

A potted plant sitting on the front seat of a car secured by a seatbelt

Here are some prepping tips, depending on how you’re getting to your new home, since the type of vehicle you use will impact how you pack and care for your plants along the way.

For Cars

  • Pack with care: Don’t seal them in a box! They need space, especially for fragile or temperature-sensitive plants. In some cases, you may want to place them in front where you can control the climate. And be sure to keep them out of the trunk, where airflow is limited.
  • Secure plants carefully: Again, you want to avoid much movement. Use seat belts to keep the plants in place. Or, if that’s not feasible, use ropes, string, or bungee cords.
  • Avoid open vehicles: It may be tempting to throw ‘em all in the back of your truck, but heavy winds and bad weather can damage plants — especially over a long time. Do yourself a favor and keep them in a covered space.
  • Consider your fragile or sensitive plants: Some of your green friends may be particular about temperature. They should go in the front, where there’s access to A/C or heat, and the driver can keep an eye on them.
  • Keep an inventory: If you have a lot of plants, you may want to keep a list of them all. This makes tracking their needs and locations easier.

For Rental Trucks

  • Store in the front cabin only: As you would in a car, place plants in the front cabin where they’ll get proper airflow and sunlight. Keep in mind that rental companies like U-Haul may even provide plastic bins to help contain any mess.
  • Clean carefully: Remember that U-Haul, Penske, and Budget Truck Rental have cleaning fees if your plants leave a mess. However, U-Haul is a little vague with its cleaning fee policy, and Budget simply claims a “reasonable fee.”

How to Prep Plants for Shipping in the Mail

polymer crystals in a gardening pot

If it’s not possible to personally drive your plants to your new destination, you’re not totally out of luck.

Believe it or not, the second-best option when moving plants across the country is to mail them. It’s not ideal since you can’t directly control how they’re handled or allow them to get water and sunlight while in transit. However, you can take steps to minimize the risks.

First, choose a fast shipping option to reduce the time in transit, but not so fast that your plants arrive at your new home before you do. And be prepared for higher shipping costs.

Here’s how to pack plants for shipping:

  • Remove the pot. Trim the roots, wrap them in a few wet paper towels, seal them with a plastic bag, and place them in a box. For longer trips, add a couple of teaspoons of polymer moisture crystals to water and apply this slurry to the roots before wrapping them in plastic. You can also loosely roll the plant in newspaper before packing it to help protect the stems and leaves.
  • Pack securely. The box you choose should be sturdy but not too roomy, as you don’t want the plant to bounce around inside. You should fill every empty space around the plant with newspaper and bubble wrap to ensure it stays secure. You can also put a “fragile,” “live plant,” or “this end up” label on the box (even better, all three) so handlers know to be careful.
  • Timing is key. Ship it at the beginning of the week. Much of the USPS doesn’t operate on weekends, increasing the odds your plants will sit in a dark room for a couple of days. Additionally, check the weather for the day of your box’s arrival so your beloved plant doesn’t freeze or wilt.
  • Note any restrictions. The law is still the law. Be sure you’re following the regulations for shipping plants in the mail.

Care for Plants When You Arrive

As soon as you arrive at your new home, you’ll have a hundred things to do. But keep in mind, unlike your flat-screen TV or dining table, plants can wilt and die. It’s important to sort out your garden and replant as quickly as possible.

  1. Get planting spots ready: Be sure to have your plants’ new homes ready to go before you take them out of their old ones. The less time your flowers and plants spend in limbo, the better.
  2. Use enough soil for transplants: If you’re transplanting from smaller pots to bigger ones, put lots of soil at the bottom and have more on hand to fill in the extra space around the edges.
  3. Prep the ground properly: If you’re planting directly into the ground, make sure each new hole is big enough, and water it thoroughly before you pull anything from its pot. Pack the soil solidly, but not so much that the water runs off and away.

Water generously in hot weather: If you can’t help but exercise your green thumb in the heat of summer, douse your freshly dug holes with even more water before transferring those plants. The roots will need lots of moisture to mitigate the shock of being uprooted and exposed to the hot air and sun.


Pro Tips for a Smooth Plant Move

several potted plants of many different species are lined up on a shelf

Ready to hit the road with your garden? Use these tips to keep your plant family happy and healthy during the drive to your new home:

  • Use plastic bins and trays to prevent leaks. You’re going to want to water your plants during the move, and all that moisture has to go somewhere. Place your pots in plastic bins or trays to keep moisture off your car seats.
  • Make a plant care kit. Be prepared to keep your plants safe on the drive by packing extra bubble wrap, a small pair of pruning shears, and plenty of water. It can’t hurt to bring some extra soil and a few extra pots in case of breaks or cracks.
  • Time your drive carefully. Heat can stress your plants, so try to travel before noon or in the early evening to keep temperatures in check.
  • Ventilate the car. Plants need plenty of fresh air, so consider cracking a window every so often. This is easy to forget, especially if you’re traveling in hot or cold weather, but it makes a big difference.
  • Download apps in advance. Download a few plant-care apps to your phone to help you handle any issues during your trip. Great options include Planta, Plant Parent, and Pl@ntNet.
  • Think before leaving plants in the car overnight. Staying at a hotel along the way? Bring your plants with you if you expect the temperature to change dramatically overnight. If the weather is consistent, crack two windows to allow ample airflow.

Learning how to move plants cross-country requires quite a few details, but it’s completely doable. By carefully choosing which plants to take and going the extra mile to prepare and transport them correctly, you can ensure they arrive safely in your new city. And with your new place filled with your old friends, it will start to feel like home before you know it.

Remote Work Index: Which U.S. States and Cities Are the Best for Remote Work?

Author:

Publish Date:

Last Modified Date:

Category: Moving Advice

Tags: Tags: , , , , , , , , , , , , , , , , , , ,

Key Findings

  • Wyoming is the top state for remote workers scoring 67.33 out of 100
  • Alaska is the worst state for remote workers with a score of just 25 out of 100
  • Nebraska is the most affordable state for remote workers with a low COL and a score of 68.57 out of 100.
  • The best city for remote workers is El Paso, Texas, which comes in with a score of 79.33 out of 100, followed by Houston and Jacksonville
  • Bakersfield, California is the worst city to work remotely with a score of 25.33 out of 100, followed by Fresno and Portland

Back in 2020, HireAHelper looked at the best small towns for working remotely in the U.S., but this came at a time when workers were encouraged to work from home. Now, over four years later, things have changed. 

While many people have returned to work in the office, and there’s an increase in RTO mandates from companies, there is still plenty of interest in remote working and its benefits. Some large companies continue to offer remote work to their employees, such as NVIDIA, and a recent study by the freelancer platform Upwork found that over a fifth of the American workforce (22%) is likely to be remote by 2025.


“…many of the top 20 cities for remote work are located in the South. In particular, Texas stands out with six cities making the list, including El Paso, Houston, Austin, and Dallas.”


But along with the freedom of remote work comes the question: where’s the best place to WFH? To help Americans find out where they should move for their remote career, HireAHelper created an index that ranked several data metrics to find out the top cities and states for remote workers.


What Makes a State or City Good for Remote Work?

When discovering the best place for remote workers to live, we considered not only what would help with a job, but the cultural and lifestyle aspects of a state/city that make it a desirable place to live as well. To put it another way, places with great amenities but are expensive, or areas that are cheaper but have poor internet reception don’t score high. In the end, we analyzed six data metrics: 

  • median income tax rate
  • average wifi speeds
  • crime rate
  • happiness of residents
  • friendliness of residents (for states)/number of coworking spaces (for cities)
  • cost of living (for states)/average rent for a 1 bedroom apartment (for cities)

Scoring high on most or all of these factors is what makes a city or state a great place to live if you work remotely.   


The Best States for Remote Workers

When it comes to the country as a whole, Western states didn’t score particularly high. This is most likely because they have a high COL and more than a few have a high income tax. A similar trend was observed in the Northeast, while the Central and Southeastern regions of the U.S. rank as top spots for remote workers.

Below, you’ll find a graph on the top 20 states, as well as a bit more on the ones who made it to the top 5 on the leaderboard.

1. Wyoming

Topping our list of the best states for remote work is Wyoming, scoring 67.33 out of 100. The state is a great place for remote workers to live as it has no income tax whatsoever, which can be nicer for those who are working freelance. It’s also an incredibly safe state, with the 5th lowest crime rate in the U.S. and is home to some of the nicest people in the nation, ranking 5th friendliness.

2. North Dakota

Ranking as the second-best state for remote work, North Dakota scored 66.33 out of 100, with consistently strong performance across all metrics. The state has some of the happiest residents in the country, with a Gallup well-being score of 57.37 and one of the lowest income taxes of all states, which sits at a median of 2.225%.

3. Nebraska

Nebraska takes third with a score of 65.33 out of 100. Generally, the people of Nebraska are happy and friendly, scoring highly for both of these attributes. And maybe that cheerful attitude can be chalked up to the low COL— it’s the 7th cheapest in the nation

4. Illinois

Illinois ranks fourth for remote workers, just a hair behind Nebraska, with a score of 64.67 out of 100. Illinoisans are among the happiest people in the U.S., ranking 8th nationwide. The state also provides fast WiFi, as well as a relatively low crime rate outside of major metros, making it easy to see why it’s great for remote work.

5. Florida

Rounding out the top five is Florida, with a score of 63.67. While it’s known for its sun, sea, and sand, the state is also a haven for digital nomads. Florida has some of the fastest internet speeds in the country, with 115.58 Mbps average download speeds, and boasts no income tax.


The Most Affordable States for Remote Workers

One of the biggest challenges when working remotely can be the cost of living. Since not all remote workers earn high salaries from tech jobs, managing daily expenses on a moderate or freelance income is something to be aware of.

To account for this, we included a cost of living metric based on the World Population Review’s Cost of Living Index, which looks at the amount needed to cover basic expenses such as food, shelter, transportation, and healthcare.

Explore the state map below to find the most affordable locations for remote work:

When double-weighting the cost of living metric, we see states rank differently than before.

Nebraska becomes the top state for affordable remote working, with a score of 68.57 out of 100, up from third place. It has especially low utility and grocery costs.

Wyoming, previously the top state for remote workers, falls to second place when affordability is more heavily considered, scoring 67.71 out of 100. The state still stands out with the 4th lowest utility costs in the country.

Illinois climbs to third place, up one place from fourth, as one of the best states for affordable remote working with a score of 66.86. The state has cheap costs for miscellaneous goods and services such as clothing, personal care products, entertainment and household goods.

Want to see how every state measures up? Then use the table below to look up any US state and how they scored under every factor:

The Best Cities for Remote Working

As you can likely tell from the map, many of the top 20 cities are located in the South. In particular, Texas stands out with six cities making the list, including El Paso, Houston, Austin, and Dallas. Florida is also well-represented, with two cities —Jacksonville and Miami — securing spots.

As for those a cut above the rest in the top five, here’s a little more on what makes them the best places to be for remote work.

1. El Paso, Texas

El Paso, TX tops our list as the best city in the U.S. for remote workers, scoring an impressive 79.33 out of 100. It has the fastest wifi speeds of any other city, with 178.3 Mbps average download speeds. It also boasts the third highest happiness scores around the country, along with the third lowest crime rate. The only downside is the lack of coworking spaces, but that can be rectified by creating a comfortable home office environment.

2. Houston, Texas

Another Texan city, Houston, ranks as the second-best city for working remotely with a score of 70 out of 100. The city has a lot of coworking spaces — 78 in total — and is one of the cities that has absolutely no state income tax. While Houston is slightly let down by its crime rate, the residents are generally pretty happy.

3. Jacksonville, Florida

Jacksonville, FL, comes in third with a score of 68 out of 100. The city enjoys the benefit of no income tax and the second fastest wifi in the country with 155.2 Mbps average download speeds. It also has consistently high scores through resident happiness, rent affordability, low crime rates, and a decent number of coworking spaces.

4. Las Vegas, Nevada

Las Vegas might be known for its wild nightlife and casinos, but did you know that it’s also an excellent destination for remote workers? In our study, the city ranked fourth with a score of 62 out of 100. There’s no income tax, lower crime rates, and average rent prices of $1,533.48 for a one-bedroom apartment in the city center. However, be warned: Las Vegas has one of the lowest happiness scores for residents in the country.

5. Phoenix, Arizona

Rounding off our top five cities for remote working is Phoenix, AZ, yet another city in the southern half of the U.S. following the trend.  The city scored a healthy 60 out of 100 for its relatively modest income tax rate of 2.5% — which is flat, meaning that’s what you pay no matter how much you earn. The average rent of $1,597.30 for a one-bedroom, city-center apartment certainly could be worse, too.

There are plenty more cities that can be great for remote work, and you can find them if you explore the full table below.

What to Look for in a Remote Work Destination

It’s no secret that remote work is still popular, with more and more workers now choosing to travel around the country (and even abroad) in the hopes of finding new experiences alongside their day jobs.


“Bakersfield, California is the worst city to work remotely with a score of 25.33 out of 100, followed by Fresno and Portland.”


But there’s more to it than the criteria we’ve explored. Even if you’ve decided on a city that’s friendly to remote work, there are some other considerations you should think about before deciding on the perfect new home.

Whether you’ve been remote working for a while, or trying to decide whether to take the plunge, Miranda Marquit, a Consumer Advocate at HireAHelper (and long-term remote worker) has put together some key factors that can influence your experience, for better or for worse.

1. A strong wifi connection 

The first thing you should do when looking for a place to work remotely is to check how fast the wifi connection is. You can do this by using online tools like Speedtest by Ookla. It’s also worth looking at the Reddit forums of your desired destination to see how other remote workers have found those locations. As a top tip if you’re more of a digital nomad, always ask your Airbnb or hotel host to send you a screenshot of the wifi speed so you can guarantee it’s good enough to work with before booking.

2. A dedicated workspace

If you’re planning on working from home, make sure your new house/apartment/the accommodation you book has a dedicated workspace. This can be a dining room table or home office space, so long as the chair is comfortable, the desk is at the right height, and the space is large enough for more than just a laptop. Be careful when booking on Airbnb! While you can filter for a dedicated workspace, sometimes the desk is a kitchen island which isn’t always the best to work from. 

See prices for local moving labor. Read real customer reviews. Easily book your help online.

3. Separate rooms if you live with a partner or friend

It can be tempting to book a studio apartment that’s significantly cheaper than a multi-room, but if you’re working remotely alongside someone, it can be hard to concentrate if you’re both shoved into the same space. If you have meetings or training calls, you’ll likely be able to hear each other. Also, if your schedules clash, and someone is cooking while the other is trying to work, it can become incredibly distracting. Even if you’re solo working, a bedroom and office separate work from play, allowing you to switch off easier in the evenings.

4. A quiet environment

Nothing can be more distracting than trying to work while there’s noise happening in the background. A property with a ton of loud ambient sound can completely upend your concentration and make working from home impossible. Check Google Maps before booking, buying, or renting anywhere to see if the property is on a main road, close to any clubs or sports stadiums, or if it’s in a flight path. Make sure to check reviews to see if there has been any mention of building work recently, or noisy neighbors.


Methodology:

To find out the best cities and states for remote workers, we analyzed all states in the country along with the top 50 most populated cities. 
We then looked at six data metrics. These were:
When analyzing the cities, we replaced the friendliness of locals for the number of coworking spaces in that location from Coworker.com, and the cost of living with the average cost of rent monthly for a one-bedroom apartment in the city centre from Numbeo.
We then gave each state and city a score based on each data metric, and a score overall with each data metric being weighted the same amount.
To find the most affordable states for remote working, we looked at the cost of living for each location and double-weighted them in the ranking to ensure cheaper states were ranked higher overall.
The data was analyzed in October 2024.

For Richer and For Poorer: How Moving Patterns of Americans Differ by Income Level

Author:

Publish Date:

Last Modified Date:

Category: Moving Advice

Tags: Tags: , , , , , , , , , , , , , , , , , , , , ,

Overall Findings

  • America’s bottom 20% of earners are 32% more likely to move than their top-earning counterparts, according to Census data for 2023
  • The top 20% of earners were more likely to move to a different state than Americans in other income brackets
  • Moving “to own a home” was nearly five times more common among the top 20% of earners (11.6% of moves) than among the bottom 20% of earners (2.5% of moves)
  • Vermont is the top destination for the top 20% of earners (net gain of 89%)
  • Oklahoma saw twice as many low-income Americans move in (net gain of 102%) than out in 2023, more than any other state

Taxes, Housing, and Gentrification: The Economic Effects of Moving

When people move, their income moves with them. This can affect local economies, both in the places they move to and in the places they leave behind.

High-income individuals moving to “cheap” cities or states have gentrification effects, observed in places like Seattle, WA, Portland, OR, and the much-publicized movement of high-earning Californians to Texas that has made housing less affordable in the Lone Star State.

In turn, California and New York have lost $90 billion in income tax revenues due to out-migration, according to the most recent IRS data.


“…Vermont is the state that gained the most of the top 20% of earners in America. As many as 89% more top earners moved here than left the state last year…[Meanwhile] Oklahoma (+102%) [had] twice as many low-income households moving into the state than leaving it.”


Moves of the bottom 20% of earners can also have profound economic consequences. Being continually priced out of buying a home or struggling to keep up with the cost of living, Americans on lower incomes flock to areas they can afford, resulting in poverty concentration. This is a phenomenon whereby certain cities or suburban areas become “predominantly poor”.

According to the HUD report, poverty concentration results in communities having serious issues with crime, health, and education, which affects both the current living standards and the future social and economic prospects of their residents.

In this study, we examine moving patterns of Americans by income level and explore how much, why, and where Americans on the opposite ends of the income scale move.

See prices for local moving labor. Read real customer reviews. Easily book your help online.


Low Earners Move More, High Earners Move Farther

The top 20% of American households by income (those earning $150,000+ per year) are much less likely to move than their relatively poorer counterparts.

In the past year, the higher earners moved at a rate of only 6.5%, in contrast to the 9% moving rate of those in the bottom 20% of households by income (those earning less than $30,000).

The most likely explanation for this is homeownership. Our moving studies and statistics show that renters are two to three times more likely to move than those who own a home outright. 

Americans with high incomes are much more likely to be homeowners and, by extension, significantly less likely to move.

As for the middle-earners who make up 60% of U.S. households, they are closer to the bottom earners in their overall mobility rate (9%), but similar to top earners in that almost one in five (18%) of those who did move in 2023 crossed state lines.


Better Housing vs Cheaper Housing: Motivations Behind Moves of Americans by Income Level

For the top 20% of American earners, home ownership is both a reason to stay and a reason to move. 

Becoming a homeowner (or “Wanted to own home, not rent” as the Census Bureau puts it) was the #3 reason for moves of those in the top income quintile with around 12% of Americans in this income bracket moving for this reason last year. 

By contrast, only 2.5% of those in the bottom 20% of earners moved because they bought a home in 2023.

The top 20% of earners were also much more likely to move for new and better housing (18%) and new jobs (12%). The poorest 20% of households only accounted for around 10% and 7% of those types of moves, respectively. 

Conversely, the poorest 20% of U.S. households were significantly more likely to move for cheaper housing (12%, compared to 6% among the top earners), health reasons (3% vs 1%), and other family reasons (10% vs 7%). “Other family reasons”, according to the Census Bureau, most often refers to moving closer to or with family to take care of them or share in childcare duties.

The middle 60% of households in the U.S. were, predictably, between the two extremes regarding motivations behind moving. Around 7% of those who moved in this bracket did so because they bought a home, and 10% moved for cheaper housing. Almost 9% moved for family reasons, and a similar share moved for a new job or transfer.

But where do Americans of different income levels actually move? The next section explores the states gaining or losing residents in different income brackets.

See prices for local moving labor. Read real customer reviews. Easily book your help online.


Top Earners Vie for Vermont, Low Earners Opt for Oklahoma: Interstate Moves by Income Bracket

Driven by different motivations, which states are people on different sides of the income scale most likely to flock to? And which states are they leaving behind?

Based on the 2023 data from the Current Population Survey, Vermont was the state that gained the most of the top 20% of earners in America. As many as 89% more top earners moved here than left the state last year.

Other states where more high-earning Americans were moving to (rather than out of) include West Virginia (+69%), Connecticut (+65%), and Iowa (+58%).


“In the past year, the higher earners moved at a rate of only 6.5%, in contrast to the 9% moving rate of those in the bottom 20% of households by income…”


The list of states with the highest gains among the bottom 20% of earners looks rather different. Oklahoma (+102%) was at the top with twice as many low-income households moving into the state than leaving it.

Iowa made another appearance in this bracket, with a net of 53% more low earners relocating here. Arizona (+45%), Texas (+43%), and Kansas (+43%) rounded out the top five.

And what about the middle class? For them, the top five states by net move gains were Delaware (+55%), South Carolina (+53%), Florida (+52%), Maine (+49%), and Georgia (+43%).

On the other side of the spectrum, the bottom 20% of earners were more likely to leave California (-57%), New Jersey (-45%), and New York (-44%) than move to these states. The top earners left Illinois (-57%), Nebraska (-47%), and Maryland (-37%) the most, while the middle 60% vacated New York (-55%), California (-45%), and Maryland (-28%) at the highest rate. 

Interestingly, Idaho and Washington saw a significant increase in the amount of top-earning Americans moving there, while simultaneously losing more low-income households.

Kansas, New Mexico, and Nebraska show the reverse trend. These states saw a significant outflow of the top 20% of households by income while posting significant net gains in the bottom 20% of earners.

As for the middle 60% of U.S. earners, they’re closer to their poorer counterparts than to the richer households when it comes to interstate moves.


High- and Middle-Income Americans Flock to Central Florida: Income-Based Moves by Metro

At a more local level, certain metropolitan areas are disproportionately popular among people in different income brackets.

For the top 20% of earners, the Deltona, FL (+171%) and College Station, TX (+132%) metros saw the highest net gain of movers out of all cities. 

Among the bottom 20% of earners, the metros posting the greatest net gains were Greensboro, NC (+80%), Fort Collins, CO (+67%), and Oklahoma City, OK (+51%).

Finally, Port St. Lucie, FL (+88%), Deltona, FL (+79%), and Cape Coral, FL (+64%) were the metro areas with the most favorable ratio of incoming to outgoing residents in the middle 60% of earners.

See which metros were most popular with Americans of different incomes on the map below.

Metropolitan areas where top earners were most likely to leave in 2023 were Omaha, NE (-84%), Louisville, KY (-75%), and Bakersfield, CA (-72%), while the low-earning households decided Boise, ID (-80%), Omaha, NE (-78%), and Baton Rouge, LA (-74%) were no longer for them.

As for the middle 60% of earners, the areas posting the highest percentage net losses in 2023 are Springfield, MA (-75%), Fayetteville, NC (-66%), and Buffalo, NY (-62%). The latter is tied with the New York, NY metro area, where 62% more middle-income Americans have moved out than they moved in last year.

For even more info on where people in different income brackets are moving, check out the tables below!


State Tables

Top 20% of Earners: States by Net Moves 

Top 10 Gain % Bottom 10 Loss %
Vermont 89% Illinois -57%
West Virginia 69% Nebraska -47%
Connecticut 65% Maryland -37%
Iowa 58% New Jersey -37%
Florida 57% Louisiana -37%
Alabama 54% Minnesota -32%
North Carolina 46% New York -25%
South Carolina 43% Maine -24%
Indiana 42% California -21%
New Hampshire 37% New Mexico -18%


Bottom 20% of Earners: States by Net Moves

Top 10 Gain % Bottom 10 Loss %
Oklahoma 102% California -57%
Connecticut 61% New Jersey -45%
Iowa 53% New York -44%
Arizona 45% Vermont -38%
Texas 43% Utah -29%
Kansas 43% Wisconsin -26%
Kentucky 40% Maryland -25%
Florida 39% District of Columbia -23%
New Mexico 39% Hawaii -21%
Rhode Island 36% Massachusetts -18%


Middle 60% of Earners: States by Net Moves

Top 10 Gain % Bottom 10 Loss %
Connecticut 96% New York -55%
Delaware 55% California -45%
South Carolina 53% Hawaii -28%
Florida 52% Maryland -27%
Maine 49% Louisiana -27%
Montana 49% New Jersey -27%
Kansas 44% Iowa -27%
Georgia 43% Illinois -27%
Arizona 39% Utah -26%
New Mexico 39% District of Columbia -25%

Metro Area Tables

Top 20% of Earners: Metros by Net Moves 

Top 10 Gain % Bottom 10 Loss %
Deltona-Daytona Beach-Ormond Beach, FL 171% Omaha-Council Bluffs, NE-IA -84%
College Station-Bryan, TX 132% Louisville/Jefferson County, KY-IN -75%
Santa Maria-Santa Barbara, CA 127% Bakersfield, CA -72%
North Port-Sarasota-Bradenton, FL 68% Ogden-Clearfield, UT -71%
Ann Arbor, MI 63% New Orleans-Metairie, LA -69%
Provo-Orem, UT 40% Chicago-Naperville-Elgin, IL-IN-WI -68%
Akron, OH 35% Minneapolis-St. Paul-Bloomington, MN-WI -65%
Austin-Round Rock, TX 34% Denver-Aurora-Lakewood, CO -63%
Knoxville, TN 33% Tulsa, OK -63%
Fresno, CA 32% Detroit-Warren-Dearborn, MI -57%


Bottom 20% of Earners: Metros by Net Moves

Top 10 Gain % Bottom 10 Loss %
Greensboro-High Point, NC 80% Boise City, ID -80%
Fort Collins, CO 67% Omaha-Council Bluffs, NE-IA -78%
Oklahoma City, OK 51% Baton Rouge, LA -74%
Pensacola-Ferry Pass-Brent, FL 24% Denver-Aurora-Lakewood, CO -72%
Charleston-North Charleston, SC 20% New York-Newark-Jersey City, NY-NJ-PA -70%
Ann Arbor, MI 20% Milwaukee-Waukesha-West Allis, WI -65%
Akron, OH 16% San Jose-Sunnyvale-Santa Clara, CA -62%
Fresno, CA 14% Raleigh, NC -61%
Cape Coral-Fort Myers, FL 13% Myrtle Beach-Conway-North Myrtle Beach, SC-NC -56%
College Station-Bryan, TX 13% Ogden-Clearfield, UT -56%


Middle 60% of Earners: Metros by Net Moves

Top 10 Gain % Bottom 10 Loss %
Port St. Lucie, FL 88% Springfield, MA -75%
Deltona-Daytona Beach-Ormond Beach, FL 79% Fayetteville, NC -66%
Cape Coral-Fort Myers, FL 64% Buffalo-Cheektowaga-Niagara Falls, NY -62%
Lakeland-Winter Haven, FL 61% New York-Newark-Jersey City, NY-NJ-PA -62%
Stockton-Lodi, CA 56% Denver-Aurora-Lakewood, CO -61%
North Port-Sarasota-Bradenton, FL 38% Rochester, NY -57%
Fort Collins, CO 32% Milwaukee-Waukesha-West Allis, WI -55%
Charlotte-Concord-Gastonia, NC-SC 17% Omaha-Council Bluffs, NE-IA -54%
Harrisburg-Carlisle, PA 12% Urban Honolulu, HI -54%
Houston-The Woodlands-Sugar Land, TX 9% Memphis, TN-MS-AR -54%


Sources and Methodology 

The primary source for all the data used in this study is the U.S. Census Bureau’s Current Population Survey and its Annual Social and Economic Supplements (as available via IPUMS).
All data on income, moves, their origins, destinations, and reasons behind them, as well as all estimates and percentages are based on moves within the United States.
For this study, the household income brackets were adopted from the DQYDJ data and calculated as follows:
  • $150,000 or more – top 20%
  • $30,000 or less – bottom 20%
  • Everyone in between – middle 60%
Net gain and loss for states and metropolitan areas was calculated as follows:
  • # of people moving into the state or city, to
  • the # of people moving out of the state or city,
  • expressed as a percentage (%)

2024 Study: Half As Many Millennials Move as a Decade Ago. Where Are They Going?

Author:

Publish Date:

Last Modified Date:

Category: Moving Advice

Tags: Tags: , , , , , , , , , , , , , , , , , , , , , , , ,

Key Findings

  • 11% of millennials moved in 2023, only half as many as a decade ago
  • “New or better housing” (16%), ”New job” (13%), and “Establishing own household” (11%) are the top stated reasons for millennial moves
  • The share of millennials moving for “Cheaper housing” (9%) in 2023 is the highest it’s been since 2011
  • Montana (+95%), Connecticut (+56%), and Maine (+54%) saw the most millennials move in, compared to moving out
  • Tampa, FL (+95%) metro saw almost twice as many millennials move in versus leave
  • Metros of New York, NY (-56%), San Jose, CA (-51%), and Los Angeles, CA (-40%) saw far more millennials leave versus move in

America’s largest generation – millennials (those born between 1982 and 2000) – are steadily rolling towards becoming middle-aged, and grappling with the fact that they may not be better off than the generations before them.

This is because millennials are among the highest earners, yet they are also the generation with the second highest level of household debt. As of last year, the share of millennials who own a home has finally reached over 50%, while some 16% are still living with their parents


[High mortgage rates and low home sales] could explain why the amount of those in this generation who move has steadily declined. The share of millennials who moved last year is half of what it was just a decade ago.”


And despite a relatively strong year for job growth and the economy in general, 2023 had the highest mortgage interest rates in recent history, with the worst home sales record in 28 years.

This could explain why the amount of those in this generation who move has steadily declined. The share of millennials who moved last year is half of what it was just a decade ago.

To understand millennials’ living situation better, we examined the trends shaping millennial moves in the United States and highlighted the cities and states that saw the most millennials leave, as well as move in.


Why the Share of Millennials on the Move Has Almost Halved Over a Decade

Reflecting broader national moving trends, the share of millennials who moved over the last decade has declined. And this decline is rather sharp! 

Unlike Gen Z whose moving rate is trending upward, only 11% of millennials moved in 2023, down from 21% the decade prior (2013).

In part, such a slowdown can be a natural consequence of people settling into their life, becoming homeowners, having children, and establishing themselves in their careers. However, as various studies suggest, millennials are less likely to own a home, be married or have kids

This is why the explanation for the declining rates of millennial moves is likely more to do with the socio-economic situation millennials find themselves in.

Housing Unaffordability

On average, aspiring first-time buyers can’t afford home ownership, due to the almost complete unaffordability of homes across the United States. 

And the millennials who can afford a home are unlikely to buy (and move into) a newer home because current mortgage rates are two to three times higher than in the previous decade.

Renting

The situation in the rental market is similarly dire. While rental rates seem to have plateaued lately, they’re still 22% higher than before the COVID-19 pandemic, while average earnings in the same period have risen by 3.2%, according to the U.S. Treasury.

Debt & Finances

Another factor that’s holding millennials back from moving is finances. Saddled with an enormous amount of debt (a lot of it from student loans), many millennials likely find themselves unable to afford to move, with many living paycheck to paycheck.

In last year’s HireAHelper moving survey, 58% of respondents (and 60% of millennials) who wanted to move said they had to stay put because they couldn’t afford to move. This combination of economic trends and financial forces leaves many Americans, millennials chief among them, locked into their current housing situation, unable to get onto the housing ladder — let alone move upwards.


New Homes and New Jobs: Top Reasons for Millennial Moves

So what about those millennials who did manage to relocate? 

The three main drivers of millennial moves in 2023, according to our analysis of the U.S. Census data, were ”Wanted new or better housing” (16%), “New job or job transfer” (13%), and “To establish own household” (11%).

When it comes to moving for new jobs, millennials are the most likely generation to make such a move. Only Gen Z comes close, with 11% of their moves taking place for new jobs.

It is also for the first time since before the declaration of the COVID-19 Pandemic that job-related moves accounted for as many as 15% of all moves that they collectively made.

At the same time, a roughly equal share of millennials moved “For cheaper housing” (9%) and more explicitly, reportedly moved because they “Wanted to own a home, not rent”(9%).


To and From: Origins and Destinations of Millennial Migration

Millennials might be moving less than before, but they still account for around 1 in 5 of all moves (18%) across state lines in 2023, based on our analysis of the U.S. Census data.

Top States for Millennials

Looking at the U.S. states, Texas attracted the highest number of millennials moving out of their home state. 

Last year, the Lone Star state welcomed almost 400,000 millennials as new residents, which is nearly 10% of all the cross-state moves made by millennials in 2023!

In terms of net moves (i.e., the ratio of those moving in, versus those moving out), the undisputed leader is Montana, where 95% more millennials moved in than left.


Last year, the Lone Star state welcomed almost 400,000 millennials as new residents, which is nearly 10% of all the cross-state moves made by millennials in 2023!”


Four other states had around 50% more millennials move in versus out: Connecticut (+56%), Maine (+54%), Oklahoma (+53%), and New Hampshire (47%).

One possible explanation for why these particular destinations were chosen is due to household income

Those making interstate moves to Maine, Connecticut, and New Hampshire had a 29% higher household income than those moving to Montana, Oklahoma, and South Carolina.

State Net Millennial Moves State Net Millennial Moves
Montana 95% New York -52%
Connecticut 56% California -39%
Maine 54% District of Columbia -33%
Oklahoma 53% Iowa -31%
New Hampshire 47% Louisiana -29%
South Carolina 40% Massachusetts -28%
Texas 39% Illinois -25%
Florida 38% Wisconsin -20%
Tennessee 38% North Dakota -18%
Arizona 37% Arkansas -11%

Bottom States for Millennials

When it comes to states millennials were most keen to leave behind, the biggest losers were New York (-52%), California (-39%), Massachusetts (-28%), and Illinois (-25%).

These states, infamous for their high cost of living, lost significantly more millennials than they gained last year.

The list of states millennials were more likely to leave also highlights their sensitivity to home prices; as many as 19% of millennials who left California, and 17% of those who left New York, moved to find cheaper housing — that was the highest percentage of housing cost-driven moves across all states.

Find out how popular your state was in the millennial cross-state migration using our interactive map below.

The Top Cities: Top Millennial Metro Destinations Are in Florida

Much like retirees, many millennials appear to be moving to cities and their metropolitan areas in Florida.

Top States for Millennials

More specifically, metropolitan areas around Tampa, FL (+95%) and Jacksonville, FL (+54%) – had some of the highest net gain of millennial residents in the country.

Slotting in between them is the Las Vegas, NV metro area, which saw 52% more millennials move in than leave last year. The Gen Z magnet Austin, TX was also up there, with 47% more millennials moving in versus out of the Austin area in 2023.

Metro Net Millennial Moves Metro Net Millennial Moves
Tampa-St. Petersburg-Clearwater, FL 95% New York-Newark-Jersey City, NY-NJ-PA -56%
Las Vegas-Henderson-Paradise, NV 56% San Jose-Sunnyvale-Santa Clara, CA -51%
Jacksonville, FL 54% Los Angeles-Long Beach-Anaheim, CA -40%
Nashville-Davidson-Franklin, TN 53% Detroit-Warren-Dearborn, MI -34%
Austin-Round Rock, TX 47% San Francisco-Oakland-Hayward, CA -31%
Bridgeport-Stamford-Norwalk, CT 40% El Paso, TX -29%
Phoenix-Mesa-Scottsdale, AZ 39% Milwaukee-Waukesha-West Allis, WI -29%
Oklahoma City, OK 38% Miami-Fort Lauderdale-West Palm Beach, FL -27%
Richmond, VA 38% Chicago-Naperville-Elgin, IL-IN-WI -26%
Raleigh, NC 37% Hartford-West Hartford-East Hartford, CT -25%

Bottom States for Millennials

As per the state-level findings, metro areas in New York and California are losing the most millennials. Both the New York City and San Jose, CA metros had over 50% more millennials leave than move in.

Curiously, both Florida and Texas featured metros on both sides of the scale. While millennials may be flocking to metros around Tampa, FL and Austin, TX, it looks like they’re moving out of El Paso, TX and Miami, FL metros.

Check out all the metros with enough move data to paint the picture in our interactive map below.


Will Millennials Move Again?

We enter 2024 with a relatively positive outlook on the economy, the real estate market, and jobs. That would suggest that if you correlate millennial migration to economic trends, as we’ve done at great length in this study, you would have to predict millennial moving could rise again soon. And for such a frequently disenfranchised generation, they can use all the good news they can get.


Sources and Methodology

All data on moves, their origins, destinations, and reasons behind them was taken from the U.S. Census Bureau’s Current Population Survey and its Annual Social and Economic Supplements, as available via IPUMS. All estimates and percentages are based on moves within the United States.
For this study, we adapted the definition of generations from Beresford Research which defined them based on their age in 2023 as follows:
  • Gen Z: 18* – 26
  • Millennials (Gen Y): 27 – 42
  • Gen X: 43 – 58
  • Baby Boomers: 59 – 77
Technically, Gen Z includes anyone from age 11, but our analysis only included moves made by adults.
Net gain and loss for states and metropolitan areas was calculated as follows:
  • # of people moving into the state or city, to
  • the # of people moving out of the state or city,
  • expressed as a percentage (%)

Illustrations by Maddy Vian

The Best San Antonio Neighborhoods in 2024

Author:

Publish Date:

Last Modified Date:

Category: Moving Advice

Tags: Tags: , , , , , , , , , , , , , , , , , ,

Whether or not you remember the Alamo, you’ll find San Antonio unforgettable. With 2.4 million residents in its metro area, this historic Southwest charmer is the second-largest city in Texas and the seventh-largest in the United States. Not to mention, downtown San Antonio currently leads the U.S. in post-COVID urban recovery.

The Mission City has a vibrant cultural scene, drawing influence from Spanish, Tejano, and Mexican roots. It also offers an eclectic mix of attractions — including UNESCO World Heritage landmarks, numerous museums and athletic events, botanical gardens, and innovative restaurants. San Antonio is the culinary capital of Texas, after all!  

Ranked among the five friendliest American cities toward new arrivals, this gem is an excellent place to begin your next chapter. On that note, here’s a look at the best San Antonio neighborhoods to call home in 2024 — and well beyond. 


Moving to San Antonio in 2024: Quick Facts

A view of San Antonio's river walk. There is a set of colorful umbrellas over tables and a bridge in the photo.

  • Population: 2,454,000 residents live in San Antonio’s metro area as of 2023, which is a 1.7% increase from 2022 
  • Rent and Housing: As of fall 2023, the average home value in San Antonio is $300K, and the average rent for an apartment is between $1,067–$1,750 per month (slightly below the national average)
  • Average Salary: The median annual salary in San Antonio is $53,245, and the average hourly rate is $25.60. The minimum wage is $7.25
  • Cost of Living: The estimated monthly expenses for a family of four is around $4,177.50. If you’re single, it will cost around $1,181.70. These costs don’t take housing into account, but they’re 8% lower than the national average
  • School Rating: San Antonio’s education system has a rating of 6.1/10, and public high schools rank 6.8/10 on the college readiness index 
  • Current Inflation: The cost of living in San Antonio rose by 1.2% from 2022 to 2023 due to inflation rates. However, if you relocate to San Antonio from Chicago, your expenses will decrease by 28%, and if you move here from San Francisco, your expenses will decrease by 54%

San Antonio is steeped in over 300 years of proud heritage, diverse arts and culture, and unique entertainment. With 66% of this city’s racial makeup identifying as Hispanic, you’ll find rich Spanish and Mesoamerican imprints all over San Antonio — just look at the mission-style architecture, the artisanal shops at El Mercado, and the authentic Tex-Mex cuisine!  

In terms of post-COVID recovery, San Antonio is on a robust upswing. Its unemployment rate has fallen to 3.7%lower than both the state and national averages. Combine this with a strong job market, no income tax, and even a few Fortune 500 companies (iHeartMedia, Valero Energy, Andeavor, and USAA), and the economic forecast looks bright. 


“Beacon Hill takes special pride in its Community Garden, a flourishing 15-year project where the locals come together to tend their plants while hosting outdoor conservation and recreational initiatives.”


The area offers a ton of entertainment options as well: Cheer on five-time NBA winners, the San Antonio Spurs, at Frost Bank Center; spend a tranquil afternoon at the lush 11-acre Japanese Tea Garden; partake in the colorful ambiance and bustling nightlife at the River Walk; and of course, visit The Alamo, named America’s “best free attraction” of 2023.


The Best San Antonio Neighborhoods

Are you in the market for a buzzing urban locale within close proximity to all the fun, trendy hotspots? Or do you want a safe, peaceful community with outdoor recreation, top-rated schools, and family oriented vibes? No matter what you have in mind, here are some of the best San Antonio neighborhoods to put down roots: 

Monte VistaA view of a bridge and stream in Brackenridge Park, located in the Monte Vista neighborhood of San Antonio

  • Median Rental Price: $1,374
  • Median Home Price: $850,000
  • Commute to Downtown San Antonio: About 10 minutes

As the nation’s largest historic district, Monte Vista is known for its charming restored homes with a unique blend of architectural features. Whether you’re looking for a traditional Georgian, an ornate Victorian, a colorful Moorish Revival, or a quaint and cozy bungalow, you will find it here.

Plus, Monte Vista is less than two miles away from the downtown core, providing you with quick, convenient access to all San Antonio has to offer. A five-minute drive will take you to the hip Pearl District with its locally-owned boutiques, eateries, and music venues. Or stay within walking distance at Candlelight Pourhouse, which serves coffee, wine, and brunch favorites. If you’re in the mood for some nature, Brackenridge Park is also nearby. 

Alamo Heights

The Quarry Theater and Quarry Market located in the Alamo Heights neighborhood of San Antonio
Alamo Quarry Market
  • Median Rental Price: $1,455
  • Median Home Price: $671,000
  • Commute to Downtown San Antonio: Less than 15 minutes

Nestled along Broadway Street, the main artery into downtown, Alamo Heights combines the thrill of an urban-adjacent location with the feel of a close-knit community, and it might just be the nicest neighborhood in San Antonio — and also one of the safest.

This San Antonio neighborhood also has a vibrant cultural scene, making it one of the city’s premier destinations for museums, galleries, shops, and restaurants. Be sure to check out The McNay, Texas’s first curated collection of modern artwork. Then, head to the Alamo Quarry Market, an old cement factory turned retail hub. And when it’s time to feed your appetite, Alamo Heights offers a variety of international culinary hotspots, such as tamales at Paloma Blanca, panang curry at Tong’s Thai, and classic Texas-style brisket at The Barbeque Station.    

LavacaA picture of the Tower of the Americas, located in the Lavaca neighborhood of San Antonio

  • Median Rental Price: $2,092
  • Median Home Price: $580,000
  • Commute to Downtown San Antonio: Less than 10 minutes

Although it’s one of the oldest San Antonio neighborhoods, Lavaca has a social and energetic spirit that will make young professionals feel at home. The local neighborhood association hosts a variety of fun social events, including a Happy Hour each week, a Block Party in October, and a Potluck Dinner in January.

Lavaca is also quite walkable, allowing you to explore its artisan retailers, coffee shops, restaurants, and green spaces on foot. Here’s a sample day in the life of a Lavacan: Check out the panoramic views of San Antonio at Hemisfair Park’s renowned Tower of the Americas, sample a bold fusion of Caribbean, Central, and Latin American flavors at Azuca Nuevo Latino, then enjoy the craft cocktails, live music, and quirky ambiance at Bar Ludivine.

Beacon Hill

The Beacon Hill Community Garden
beaconhillsanantonio.org
  • Median Rental Price: $1,511
  • Median Home Price: $318,800
  • Commute to Downtown San Antonio: Less than 15 minutes

As one of the more affordable San Antonio neighborhoods, Beacon Hill welcomes new residents in all stages of life. You’re sure to fall in love with the distinctive wall murals and art installations, easy access to nature activities, and Spanish Colonial-style bungalows this area is known for.

Beacon Hill takes special pride in its Community Garden, a flourishing 15-year project where the locals come together to tend their plants while hosting outdoor conservation and recreational initiatives. This district also serves up irresistible comfort food, like the thin crust pizzas over at SoHill Café or the famous tostada burger at Chris Madrid’s. Finally, be sure to check out B-Side, a newly opened entertainment space for music and art shows.

Southtown

The Blue Star Art Complex located in the Southtown neighborhood of San Antonio
Blue Star Art Complex
  • Median Rental Price: $1,401 for a one-bedroom apartment
  • Median Home Price: $250,000
  • Commute to Downtown San Antonio: About 5 minutes

This creative niche, about a mile away from the urban center, flies under many tourists’ radar— but that’s exactly what makes Southtown such an inviting place to call home. As the unofficial artistic capital of San Antonio, you’ll come across a diverse assortment of top-notch museums, eclectic shops, and funky restaurants here.

Grab a latte from Halcyon Coffee Bar and stroll through the Blue Star Arts Complex, a converted warehouse that now hosts multimedia venues, studios, galleries, and much more. Browse the selection of music albums at Southtown Vinyl, before putting your own creative flair to the test with a gourmet build-your-own cinnamon roll over at Cinnaholic.  

See prices for local moving labor. Read real customer reviews. Easily book your help online.

El Dorado

  • Median Rental Price: $1,599
  • Median Home Price: $285,000
  • Commute to Downtown San Antonio: About 20 minutes

If you want a safe, inexpensive neighborhood in the suburbs with high-quality public schools, accessible outdoor recreation, and spacious homes to raise a family, look no further than El Dorado.


“The cost of living in San Antonio rose by 1.2% from 2022 to 2023 due to inflation rates. However…if you move here from San Francisco, your expenses will decrease by 54%”


While not as close to downtown San Antonio as some other zip codes in the metro area, it’s just a 20-minute drive on the freeway to reach those urban landmarks and attractions. Plus, El Dorado has fun entertainment options in its own vicinity. Spend an afternoon kayaking, fishing, or bird watching at El Dorado Private Lake Park. Explore various walking trails, athletic fields, swimming pools, and other amenities at Lady Bird Johnson Park. And tempt your taste buds with the unique local dining spots on Nacogdoches Road.   


Whether you prefer the urban core on your doorstep or suburban feels outside the city, these San Antonio neighborhoods above are definitely worth checking out. Best of luck to you as you start your new adventure!


2024 Study: A Look at the Biggest Wave of Retiree Moves in Three Years

Author:

Publish Date:

Last Modified Date:

Category: Moving Advice

Tags: Tags: , , , , , , , , , , , , , , , , , , , , , , , , , , , ,

Key Findings

  • More than 338,000 Americans moved to retire in 2023, an increase of 44% compared to 2022
  • Florida is the top destination for retirement moves that crossed state lines, attracting 11% of them in 2023
  • California (18%) and New York (11%) have the highest share of retirees moving to new states 
  • Miami-Fort-Lauderdale, FL is the #1 metro for retirement moves, with 12.3% of them headed to this area in Florida
  • Nearly a quarter (23%) of all Americans moving to retire were early retirees aged under 55

The year 2023 was a big year for retirement moves!

According to the U.S. Census Bureau data, retirement moves reached a three-year high! With housing markets cooling off, inflation slowing down, and social security benefits increasing, it’s no surprise that 44% more Americans moved in retirement compared to in 2022.

How else have these developments affected moving after retirement in 2023? Where did retirees relocate to, and which places did they leave behind?

In this latest edition of our annual retirement moves study, we look at trends that shaped moving in retirement in 2023, highlight top origins and destinations, and zoom in on the changing demographics of retirees on the move.


an illustration of a colorful cocktail, but the ice cubes are depicted as moving boxesBucking the Trend: Retirement Moves Continued Rising Through 2023

In 2023, when the share of Americans who moved fell to a historic low of 7.8%, retirement moves registered a 44% growth compared to the year prior. That equates to more than 338,000 Americans moving to retire in 2023 — the highest in three years.

This means that after falling briefly during COVID, the number of Americans moving to retire has grown for the third consecutive year.

Similarly to the findings in our previous studies of moving for retirement, Americans who moved at this stage of their lives were more likely to relocate to a different state last year. A quarter (25%) of retirement moves in the U.S. in 2023 crossed state lines, compared to 18% of moves overall.


Sun, Sun, Sun: Florida Tops State Destination Rankings, Again

For those Americans choosing to retire out of state, Florida was again the number one destination in 2023. The Sunshine State attracted around one in ten (11%) of all retirement moves that went to a different state.

South Carolina gave Florida a good run for its money as the destination for 10% of all cross-state retirement moves in 2023. Meanwhile, New Jersey and Texas each accounted for roughly 6% of such moves, respectively.


“The 2023 crop of retirees on the move was significantly younger…37% of them were under the age of 65, including 23% who were under 55.”


As for the states retirees are leaving, the greatest share of relocating retirees came from California, with 18% of all retirement moves that crossed state lines originating in California. New York contributed a further 11% of retirees seeking a new place to live outside their home state.

Curiously enough, states like New Jersey and Pennsylvania appear on both receiving and leaving lists. This has to do with the fact that while many people do move to Florida and New Jersey for retirement, a similar amount of people are leaving these states too.

See prices for local moving labor. Read real customer reviews. Easily book your help online.


Miami Remains a Retirement Magnet: Top Metros for Retirees on the Move

In another victory for Florida, Miami-Fort Lauderdale was the top destination for retirement moves in 2023.

This metro located right on the Atlantic coast is well within its right to attract many of those seeking a great place to retire. Highland Beach — one of Fort Lauderdale’s suburbs — ranks #3 as the best place to retire according to Niche.com, while Miami is in the fourth spot of CN Traveller’s ranking of best retirement destinations. 

And even though the cost of living in the Miami-Fort Lauderdale metro is on the rise, it’s still significantly lower than in the U.S. biggest cities. 

Other popular metropolitan areas last year included El Paso, TX (~8% of moves), and yet another Florida metro: North Port-Sarasota-Bradenton, FL (6%).

In the Midwest, Kansas City, MO-KS, and Cleveland-Elyria, OH each took about 3% of all retirement moves that took place in 2023. Both these metros have likely attracted many retirees due to affordable housing and a generally lower cost of living


“In 2023, when the share of Americans who moved fell to a historic low of 7.8%, retirement moves registered a 44% growth compared to the year prior. That equates to more than 338,000 Americans moving to retire…”


Retirees with money

The fact that two Californian metros feature on the top 10 list of retirement move destinations in 2023 suggests two parallel trends within retirement moves. 

Retirees with a good amount of savings and high pensions are likely moving to metros like Miami-Fort Lauderdale, FL and San Luis Obispo-Paso Robles, CAFolks looking to save money in retirement, on the other hand, are more likely to choose El Paso, TX, and Kansas City, MO-KS — areas where settling down for retirement won’t cost a fortune.

To browse states and metros you may be interested in, check out the interactive map below:


Health and Family: Key Reason Behind Retirement Moves in 2023

Besides retirement itself, some of the most common reasons contributing to retirement movies in 2023, according to a recent U.S. Census Bureau moving data report, were said to do with family and health. “Better housing” and “cheaper housing” did remain relevant, but they’re not driving as many moves as they did in 2022.

It’s worth noting that “other family reason” was most often clarified to mean adding a new family member (e.g., pregnant, had a baby, adoption), moving with family member(s), or assisting or taking care of family members. 

Because adding a new family member is unlikely for someone of retirement age, it’s safe to assume that the majority of retirees who moved citing “other family reason” did so to be closer to family, either to help take care of them or to receive care themselves.


“…the median household income of retirees who moved in 2023 was $88,347, which is 17% higher than a typical household income in the United States…”


This is consistent with the findings of our study of the Sandwich Generation — meaning adults “sandwiched” between taking care of their aging (and likely retired) parents, and their children.

More than a quarter (26%) of the respondents in our Sandwich Generation survey were considering moving their parents closer to give them the care they need, and 24% were thinking about their parent(s) moving in with them.

With so many retirees factoring in family and health into their moves in 2023, it’s likely this emerging trend is already starting to unfold.

See prices for local moving labor. Read real customer reviews. Easily book your help online.


Younger, Wealthier, and Most Likely Single: The Demographics of Retirees Moving in 2023

One standout feature of 2023 moving retirees is that they were overwhelmingly more likely to be single. (Or, at the very least, not married.) 

In 2022, more than half (55%) of retirees moving were spouses. But last year, that share dropped to just 45% — the lowest percentage ever on record.

The 2023 crop of retirees on the move was significantly younger as well, as 37% of them were under the age of 65, including 23% who were under 55. Compare this to just 26% of 2022 retirees who were under 55. 

In another change compared to 2022, a third (33%) of American retirees moving in 2023 were people of color, up from 14% the year before. 

Finally, the median household income of retirees who moved in 2023 was $88,347, which is 17% higher than a typical household income in the United States, according to the latest data. It is also 35% higher than the median income of someone moving into retirement last year, which was just above $65,000.


Sources and Methodology
Unless otherwise stated, all the data behind the charts in this study were taken from the U.S. Census Bureau’s Current Population Survey and its Annual Social and Economic Supplements for 2023. 
To calculate the most moved-in and moved-out states and cities, we took the percentage of all retirees in 2023 who moved or left a state or city.

Illustrations by Daniel Fishel

2023 Study: The Year Gen Z Adults Moved More Than Any Other Generation

Author:

Publish Date:

Last Modified Date:

Category: Moving Advice

Tags: Tags: , , , , , , , , , , , , , , , , , , , , , , , , , , , , , , , , ,

Key Findings

  • Gen Z is the most mobile generation, as 17% of its adult members moved in 2023, compared to 8% across all ages
  • Around 16% of moves by Gen Z adults were to “establish their own household” – the highest percentage of all generations
  • Texas welcomed the most Gen Z overall (345,000), but West Virginia saw the highest net gain in Gen Z moves (+138%)
  • Vermont (-73%), Alabama (-68%), and Mississippi (-64%) were the states Gen Z were most likely to leave
  • The NYC metro area saw the biggest numeric influx of Gen Z members (183,000), but Austin-Round Rock, TX (+106%) had the greatest net gain

Generation Z — or Zoomers, as they’re sometimes called — have been the subject of many headlines lately. As they come of age, their differences from other generations in terms of workplace habits, home ownership ambitions, political views, and the use of technology are increasingly well-documented.

But what about moving? We know that Gen Z, like the generation before them, is burdened with less favorable economic outlooks, including poor housing affordabilityhigh rent, and student debt. Presumably, in light of these factors, some surveys find a record number of young adults are staying put and living with their parents


“In absolute terms, their top destination was Texas, which welcomed 345,000 new Gen Z residents in 2023. However, the state with the greatest net gain of Gen Z moves was West Virginia. “


When we look at the moving data, however, a different trend emerges. Despite making up just 12% of the population, Gen Z adults (aged 18 to 26) accounted for 26% of all moves that took place in America this year

In this study, we take a deep dive into Gen Z moving patterns to uncover how actively they’re moving compared to other generations, highlight what motivates their moves and reveal where they’re moving to and from.


Zoom Zoom: Gen Z is the Most Mobile of All Generations in 2023

The thing about America is that, as a nation, we move a lot less now than we did a few decades ago. Save for a blip in 2022 when the percentage went up, the overarching trend has been pointing down since the mid-1980s.

However, this isn’t true for Gen Z at all. 17% of them moved in 2023 — a number twice as high as the national average. It was also the highest out of all other generations.

By comparison, only 11% of Millennials (Gen Y) moved this year. That share dips even lower for older generations, as 5% of Gen X and just 3% of Baby Boomers changed where they live in 2023.

Not only are Gen Z the most mobile generation, but they’re also the ones bucking the overall downward trend in movingAfter a drop in 2020, which was likely caused by the COVID-19 pandemic, more and more Gen Z adults have been moving each year. And they’re the only generation to do so. 

Flying the Nest to Make Their Own: Key Reasons Behind Moves of Gen Z Members

Based on the U.S. Census Bureau data, the most common reason for moving among Gen Z members in 2023 was “establishing their own household”, i.e. most likely moving out of their parents’ home. 

Responsible for around 17% of all Gen Z moves, it was more popular with this generation than any other. Another reason for moving most distinctly popular with Gen Z was “relationship with unmarried partner” (read: move in with a significant other).

This reason drove around 8% of moves by Gen Z adults in 2023, which is higher than any other generation and is above the 5% national average. 

Despite reports of increased home-buying activity, Gen Z has the lowest share of moves associated with becoming a homeowner (≈5%) compared to other generations. 

At the same time, 9% of Gen Z adults moved for cheaper housing in 2023. The only generation for whom it was higher was Baby Boomers (10%).

See prices for local moving labor. Read real customer reviews. Easily book your help online.

Almost Heaven: West Virginia Records Highest Net Gain in Gen Z Moves in 2023

So Gen Z is moving in record numbers, but where are they moving to and from?

In absolute terms, their top destination was Texas, which welcomed 345,000 new Gen Z residents in 2023. However, the state with the greatest net gain of Gen Z moves was West Virginia

In 2023, 138% more Gen Z adults moved to this state than left it. Four others — Utah (+137%), South Carolina (+136%), Colorado (+107%), and Kansas (+107%) — had at least twice as many members of Generation Z move in than move out.

States by net moves (only interstate moves are included)

State Net Gen Z Moves State Net Gen Z Moves
West Virginia 138% Vermont -73%
Utah 137% Alabama -68%
South Carolina 136% Mississippi -64%
Colorado 107% New York -57%
Kansas 107% Iowa -53%
Washington 97% Minnesota -53%
Idaho 96% North Carolina -48%
Kentucky 76% Wyoming -47%
Ohio 54% California -43%
Pennsylvania 52% Arkansas -43%

On the flipside, members of Gen Z were most likely to leave Vermont (-73%), Alabama (-68%), and Mississippi (-64%). It’s worth noting that New York (-57%) and California (-43%)  are states that often come out on top of net outflow rankings, and they feature here in the 4th and the 9th spot respectively. And speaking of the volume of moves, California alone saw over 415,000 Gen Z people leave the state in 2023.

To see what the Gen Z moving patterns looked like for all other states, check out our interactive map below.

Austin, TX Metro is a Gen Z Magnet: Top Destinations for Gen Z Moves

Texas and Florida didn’t feature high in state rankings, but their metros sure are up there for moving destinations among Generation Z members.


“17% of [Gen Z] moved in 2023 — a number twice as high as the national average. It was also the highest out of all other generations.”


Austin-Round Rock, TX (+106%) is in first place — it had twice as many Gen Z members move in than out of it. Florida, on the other hand, is represented by metro areas around Tampa, FL (+55%) and Jacksonville, FL (+38%), both posting healthy net gains. 

In line with state-level findings, Columbia, SC (+82%), Provo-Orem, UT (+53%), and Colorado Springs, CO (+37%) feature among the 10 metropolitan areas with the highest net gain in moves by Gen Z.

Metros by net moves

Metro Net Gen Z Moves Metro Net Gen Z Moves
Austin-Round Rock, TX +106% San Jose-Sunnyvale-Santa Clara, CA -39%
Oklahoma City, OK +88% Detroit-Warren-Dearborn, MI -37%
Columbia, SC +82% New YorkNewark-Jersey City, NY-NJ-PA -33%
Las Vegas-Henderson-Paradise, NV +71% Chicago-Naperville-Elgin, IL-IN-WI -32%
Nashville-Davidson-Murfreesboro-Franklin, TN  +78% Minneapolis-St. Paul-Bloomington, MN-WI -26%
Tampa-St. Petersburg-Clearwater, FL +55% Pittsburgh, PA -24%
Provo-Orem, UT +53% Los Angeles-Long Beach-Anaheim, CA -24%
Virginia Beach-Norfolk-Newport News, VA-NC +51% Miami-Fort Lauderdale-West Palm Beach, FL -24%
Jacksonville, FL +38% San Francisco-Oakland-Hayward, CA -22%
Colorado Springs, CO +37% Indianapolis-Carmel-Anderson, IN -20%

The other side of the table is dominated by metropolitan areas in California. As some of the most expensive places to live in the United States, metro areas around cities such as San Jose, CA (-39%), Los Angeles, CA (-24%), and San Francisco, CA (-22%) all many more Gen Z members leave than relocate here.

Incidentally, Florida also has a metropolitan area with one of the highest net losses of Gen Z residents. About 24% more members of Generation Z moved out of Miami-Fort Lauderdale-West Palm Beach, FL than moved there in 2023.

Curious about what the situation is near you? We’ve put all metros with a significant number of moves by Gen Z adults onto this interactive map.


Sources and Methodology

All data on moves, their origins, destinations, and reasons behind them was taken from the U.S. Census Bureau’s Current Population Survey and its Annual Social and Economic Supplements, as available via IPUMS. All estimates and percentages are based on moves within the United States.
For this study, we adapted the definition of generations from Beresford Research which defined them based on their age in 2023 as follows:
  • Gen Z: 18* – 26
  • Gen Y (Millennials): 27 – 42
  • Gen X: 43 – 58
  • Baby Boomers: 59 – 77
Technically, Gen Z includes anyone from age 11, but our analysis only included moves made by adults.
Net gain and loss for states and metropolitan areas was calculated as follows:
  1. # of people moving into the state or city, to
  2. the # of people moving out of the state or city,
  3. expressed as a percentage (%)

Moving to Dallas: The Best Dallas Neighborhoods in 2023

Author:

Publish Date:

Last Modified Date:

Category: Moving Advice

Tags: Tags: , , , , , , , , , , , , , , , , ,

If you’re thinking of moving to Dallas, Texas, you’re not the only one. Ever since the pandemic, the Dallas-Fort Worth Metroplex has been one of the top moving destinations the country. After all, who doesn’t love cowboys, Tex-Mex, football, and BBQ?

Keep reading to learn why so many people are flocking to the “Big D”, as well as some of the best Dallas neighborhoods that have captured the hearts of residents and newcomers alike.


Dallas City Facts

a view of downtown dallas at night

First things first, let’s check out some quick facts about the city:

  • Dallas is in North Texas: It’s located about 3 hours north of Austin, 3 ½ hours north of Houston, and 4 hours north of San Antonio
  • Dallas is huge: With 1.3 million residents, it’s the 9th most populous U.S. city
  • Dallas is sprawling: It has a population density of 3,841 people per square mile. Compare that to NYC or L.A., which have over 29,300 and 8,300 people per square mile, respectively. 
  • Dallas is part of a mega metro: Dallas and nearby Fort Worth are just two cities in a giant, 13-county metro dubbed “DFW” or simply “the Metroplex”. DFW has a population of over 7.5 million (more than the entire country of Denmark!)
  • Dallas is diverse: Out of 501 of the largest cities in America, Dallas is the 9th most diverse, according to WalletHub

Moving to Dallas in 2023 

a view of the Margaret Hunt Hill Bridge leading into downtown Dallas

During the pandemic, many Americans found themselves working remotely (or not at all) for extended periods of time. Many took it as an opportunity to move closer to family or to more affordable cities. And which metro area were most people moving to? Why, that would be Texas. Over the course 2021–2022, the DFW Metroplex saw the largest population increase of any U.S. metro area, with more than 170,000 people moving in.


“…there are [also] some great options outside Dallas city limits. For those who want to take advantage of all that DFW has to offer, moving to one of the middle cities is probably the way to go.”


Even though life has mostly returned to normal, the Dallas-Fort Worth Metroplex continues to be a popular destination for people who are moving. In 2022, DFW ranked number 2 on PODS’ list of cities with the most move-ins. This year it remained in the top ten at number 6.


Why are so many people moving to Dallas?

Are you wondering if it’s a good idea to move to Dallas, Texas? Over 100,000 people a year can’t be wrong. From living expenses to quality of life, here are a few of the main draws:

  • Low taxes: Texas doesn’t impose an individual income tax and has a lower tax burden than 28 other U.S. states
  • Strong economy: In the first 3 months of 2023, Texas experienced a 3% growth in its GDP (gross domestic product), surpassing all other major cities and the U.S. as a whole. Between June 2022 and June 2023, Texas also added more jobs (542,500) than any other state
  • Affordable cost of living: The cost of living in Dallas is just 3% above the national average, which isn’t bad for such a big city
  • Travel hub: Dallas has an international airport (DFW) and is conveniently located about halfway between the East Coast and West Coast, making it a prime location for frequent travelers
  • Dining and entertainment: Not only is DFW a foodie’s dream, but both Dallas and Fort Worth are common stops for big-name music acts touring across the U.S.

See prices for local moving labor. Read real customer reviews. Easily book your help online.


What does it cost to live in Dallas?

The overall cost of living in Dallas is just slightly above the national average. Rentals, groceries, and transportation are all cheaper in Dallas, but these are somewhat offset by the higher costs of housing and utilities. Here’s a look at how living costs in Dallas compare to national averages.

  • The cost of living in Dallas is 3% higher
  • Utility costs in Dallas are 14% higher
  • The median home sale price in Dallas is $454,525 — about $29,000 more
  • Median rent in Dallas is $1,541, which is about $204 less
  • The average apartment size in Dallas is 848 square feet — 49 square feet smaller

Best Dallas Neighborhoods Guide

Deciding to move to Dallas is the easy part. Choosing your new Dallas neighborhood can be a little trickier. To help take some of the guesswork out of it, here are some of the best Dallas neighborhoods worth checking out.

1. Lake Highlands — Best Dallas Neighborhood for Families

A view of a fishing dock in White Rock Lake, which is near Lake Highlands. The downtown skyline of Dallas can be seen in the distance

  • Median rental price: $1,597
  • Median home sale price: $561,000
  • Commute to Downtown Dallas: 20 minutes

The Lake Highlands neighborhood is one of the best Dallas neighborhoods for families. Located northeast of Downtown Dallas and bordering the cities of Garland and Richardson, this area is made up of dozens of subdivisions including Forest Meadow, Moss Farm, and Town Creek.

Students here have access to plenty of great schools since Lake Highlands is serviced by A-rated school districts in neighboring Garland and Richardson. Those looking for a higher education can take advantage of the Dallas College–Richland Campus in the north, which is one of the best community colleges in Texas


“In the first 3 months of 2023, Texas experienced a 3% growth in its GDP, surpassing all other major cities and the U.S. as a whole. Between June 2022 and June 2023, Texas also added more jobs (542,500) than any other state”


There are several local parks and green spaces in the south part of the neighborhood. And just 15 minutes away you’ll find the ever-popular White Rock Lake and the Dallas Arboretum and Botanical Gardens. 


2. Uptown — Best Dallas Neighborhood for Young Professionals

a view of Uptown Dallas at night, along with the famous vintage trolley

  • Median rental price: $2,677
  • Median home sale price: $485,000
  • Commute to Downtown Dallas: 8 minutes

Uptown Dallas is considered one of the most walkable communities in the city. This is a place where young professionals can live, work, and play, all in the comfort of their own neighborhood. McKinney Avenue is the place for singles to mingle, with its own trolley shuttling locals and visitors from hip bars to trendy eateries and back.

A big plus to living in Uptown is its central location. Just north of the neighborhood is the Katy Trail and lovely Turtle Creek Park. Other popular neighborhoods are nearby, such as Downtown, Oak Lawn, Deep Ellum, and the City Center District. When you’re living in Uptown, being bored really isn’t an option!


3. Deep Ellum — Best Dallas Neighborhood for Culture

a street in Deep Ellum, a trendy Dallas neighborhood full of food, entertainment, and nightlife
deepellumtexas.com
  • Median rental price: $1,805
  • Median home sale price: $480,000 (87% rent rather than own and homes to purchase are rare)
  • Commute to Downtown Dallas: 7 minutes

If you’re into live music, eclectic foods, and an overall awesome atmosphere, then Deep Ellum is the place for you. Originally called Deep Elm (after Elm Street), this neighborhood holds historic and cultural significance as one of the city’s first commercial districts for African-Americans and European immigrants. Today, Deep Ellum is home to more than 400 businesses, including everything from live music venues and foodie hot spots to tattoo parlors and vintage stores.

With live shows happening every night of the week, Deep Ellum is where all Dallas music lovers eventually end up — so why not just live here?


4. Parkdale-Lawnview — Best Dallas Neighborhood for People on a Budget

  • Median rental price: $1,800
  • Median home sale price: $215,000
  • Commute to Downtown Dallas: 12 minutes

Parkdale’s allure lies in its picturesque outdoor spaces. Local parks filled with cypress and pecan trees and wide open fields can be found in the north and south, while White Rock Creek and Parkdale Lake make up the west side of the neighborhood. And just 6 miles away, nature lovers can explore the magnificent 6,000-acre Great Trinity Forest.


“Dallas and nearby Fort Worth are just two cities in a giant, 13-county metro dubbed ‘DFW[‘ or simply ‘the Metroplex’. DFW has a population of over 7.5 million (more than the entire country of Denmark!)”


Parkdale is mostly residential, a neighborhood in the truest sense of the word. Fostering a close-knit community, the Parkdale Lawnview Association of Neighbors (P.L.A.N.) organizes community events like the Fall Festival and a Thanksgiving lunch feast for police officers. 

For those moving to Dallas without a car, the Dallas Area Rapid Transit (DART) Green Line’s Lawnview Station is located at Parkdale’s southwest corner, making it easy for commuters to get around. 


Other Great Places to Live in DFW

You may have your heart set on moving to Dallas, but you should know that there are some great options outside Dallas city limits. For those who want to take advantage of all that DFW has to offer, moving to one of the middle cities is probably the way to go.

My friend Heather decided to move to Dallas in 2018, but ended up settling in Arlington. “It’s great because it’s halfway between Dallas and Fort Worth,” she told me, “So I was always less than 30 minutes from either city center.” Here are the best places for easy access to both Dallas and Fort Worth:

Arlington, TX

a view of Arlington's skyline, featuring the Rangers' stadium and Six Flags roller coasters

  • Median rental price: $1,850
  • Median home sale price: $340,000
  • Commute to Downtown Dallas: 26 minutes
  • Commute to Downtown Fort Worth: 22 minutes

Spanning over 95 square miles with 86 neighborhoods, Arlington is a pretty big city in its own right. It’s so big that it’s divided into five sections — North Arlington, East Arlington, West Arlington, Southeast Arlington, and Southwest Arlington (I know, it’s a lot!). In addition to being home to nearly 400,000 residents, Arlington is also home to AT&T Stadium (where the Dallas Cowboys play), Globe Life Field (where the Texas Rangers play), and Six Flags Over Texas (where everyone else plays). 

Even though you could probably never leave Arlington and still have everything you need, there are five freeways running through the city, making the drive into either Dallas or Fort Worth a breeze. 


Southlake, TX

an arial view of Southlake's city center

  • Median rental price: $5,600
  • Median home sale price: $1,325,000
  • Commute to Downtown Dallas: 30 minutes
  • Commute to Downtown Fort Worth: 30 minutes

If you haven’t already guessed by the median home sale price, the DFW suburb of Southlake is bougie. This upper-class neighborhood is located southwest of Grapevine Lake and has a lot to offer its residents. Southlake neighborhoods are filled with massive, single-family homes, surrounded by uncannily green lawns. The Town Square is super walkable with sidewalks shaded by mature oak trees, and an array of high-end retailers. It’s basically the Beverly Hills of Dallas!

Southlake was rated the #1 suburb to raise a family in DFW, according to Niche. This is likely thanks to the stellar schools, beautiful parks and greenspaces, and all the community events put on by the city throughout the year.  All in all, it’s a great place to live — if you can afford it.

See prices for local moving labor. Read real customer reviews. Easily book your help online.


Dalworthington Gardens, TX

  • Median rental price: $1,500
  • Median home sale price: $515,000
  • Commute to Downtown Dallas: 33 minutes
  • Commute to Downtown Fort Worth: 20 minutes

If you’re looking for something with a little more of a small-town feel but still is within throwing distance of major cities, you should try Dalworthington Gardens. The story goes that this town was named as such to incorporate the names of Dallas, Fort Worth, and Arlington into one. And Dalworthington Gardens is certainly a wonderful place to settle so you can still visit all three.

It has a tight-knit community of around 2,500 with a rich history of being a Depression-era homestead. There are events, green spaces, and local restaurants, bars, and cafes a plenty. It’s also a popular place to retire.


Dallas is an amazing city with so much to offer. No matter where in the Metroplex you end up, I know you’re going to have an amazing time (and some amazing BBQ). In the meantime, good luck with your move and don’t forget to enjoy the adventure!

2023 Study: Insights Into the 26% of Americans in the Sandwich Generation

Author:

Publish Date:

Last Modified Date:

Category: Moving Advice

Tags: Tags: , , , , , , , , , , , , , , , , , , , , ,

Key Findings

  • Based on survey findings and Census data, around 26% of U.S. adults are “sandwiched” between taking care of their children and their aging parents
  • California is the state with the highest proportion of adults in the Sandwich Generation (39%), and Texas is in 2nd place with 33%
  • 35% of Sandwich Generation adults support their parents financially, spend around $725/month, amounting to between 13% and 16% of their household income.
  • 61% are concerned about the future and 50% worry about being able to continue to juggle supporting their parents and their children
  • Almost two-thirds (63%) of respondents in our survey are looking to either move in with their parents or have their parents move in with them in the next five years

Meet the Sandwich Generation — adults who are “sandwiched” between their aging parents and their children by having to financially support and/or care for both. According to our estimates, some 26% of American adults are part of the Sandwich Generation, which equates to about 67.8 million people.

Why do so many Americans find themselves in this living arrangement? It’s a mixture of both demographic and socio-economic factors:

  1. Older Americans enjoy an increasing life expectancy, and more need support in their advanced age.
  2. More people are choosing to have children later in life.
  3. The cost of living continues to rise, so more and more young adults are living with their parents or relying on them for financial support.

For this study, we surveyed 1,000 members of the Sandwich Generation to find out more about their family situation, the challenges they face, and their feelings about it. We also combined our findings with the U.S. Census Bureau data to estimate the number of people in the Sandwich Generation and how they’re spread across the United States.


Caught in the Middle: Demographics of the Sandwich Generation

Pew Research defines the Sandwich Generation as those who have both a living parent aged 65 or older and at least one child who is either under 18 or an adult child who still needs financial support.

Based on the data from the Current Population Survey and our own survey that polled 1,000 members of the Sandwich Generation, we estimate that 26% of American adults (approximately 67.8 million people) are “sandwiched” between supporting both their children and their aging parents. This is up from 23% in 2022, as found by the Pew Research study.


“It’s worth pointing out that in Sandwich Generation families, care and support go both ways. Over half (57%) of Sandwich Generation adults are supported by their 65 or older parents socially, and 40% get help with kids.”


According to our survey, women make up the majority of the Sandwich Generation (58%), while men account for 42%. Age-wise, two-thirds (66%) of those in the Sandwich Generation are in their 30s or 40s.

Among those surveyed, 59% are supporting their parents aged 65+ and at least one child aged under 18, making it the most common variation of the family setup.

A further 17% have parents aged 65 or older and adult children living at home, while approximately 1 in 10 adults in the Sandwich Generation supports their 65+ parents and adult children who live separately. 

There is also a minority (7%) of adults who not only support their parents aged 65 or older, but also have at least one child under 18 and a child aged 18 or older living with them. 

Sandwiched in the Sun Belt: Mapping the Sandwich Generation

Even though the trends shaping the Sandwich Generation — such as the growing cost of living — apply to the whole of the U.S., there are certain regional differences in this demographic.

Based on the data from the combination of the Current Population Survey, the American Community Survey, and the survey we conducted, California has the highest proportion of Sandwich Generation adults in its population (39%).

There are four other states where that share is over 30% and they are Texas (33%), Nevada (31%), Mississippi (31%), and Arizona (31%).

State Estimated % of adults in the Sandwich Generation
California 39%
Texas 33%
Mississippi 31%
Nevada 31%
Arizona 31%
Maryland 30%
Georgia 29%
New Mexico 29%
New York 29%
Florida 29%

One reason so many states in The Sun Belt make up the top ten is that these states have some of the highest average family sizes. Meaning that families in these states are more likely to have more children than families in other parts of the country.

That being said, the family size alone doesn’t explain why New York and Maryland make the top ten. Instead, what these states have in common is a high cost of living, which results in more young adults needing the financial support of their parents. According to the Missouri Economic Research and Information Center, New York has the 5th highest cost of living of all states and Maryland is 7th highest in that ranking.

This brings us back to why California is the Sandwich Generation hotspot: it’s the state with the second-largest family size and the fourth-highest cost of living.

To see what percentage of adults are in the Sandwich Generation in your state, check our interactive map below.

Networks of Care: How Sandwich Generation Families Make it Work

As we have established above, being part of the Sandwich Generation generally means caring for and supporting your parents and children, and there are different ways individuals go about it.  


“…59% of respondents agree that caring for their children and parents makes them feel fulfilled and invigorated.” 


Among our survey participants, most support their aging parents socially (75%) and emotionally (68%). Nearly half (45%) support their aging parents financially (including housing), and 31% support their parents with acts of physical care, such as helping with medical needs or day-to-day activities.

Those supporting their parents financially spend an average of $725 per month on it, accounting for between 13% and 16% of their household income.

I like being able to [take care of my parents],” said one of the Sandwich Generation adults we surveyed. “But my money is stretched out to the max”.

When it comes to caring about their adult children, emotional (45%) and financial support (39%) are the two most common ways adults in the Sandwich Generation help their kids.

Those supporting their adult children financially estimate their extra spending at an average of $567 per month, to the tune of 6% and 8% of the household income.

an illustration of a sandwich filled with roast beef, olives, tomatoes, lettuce, and bread
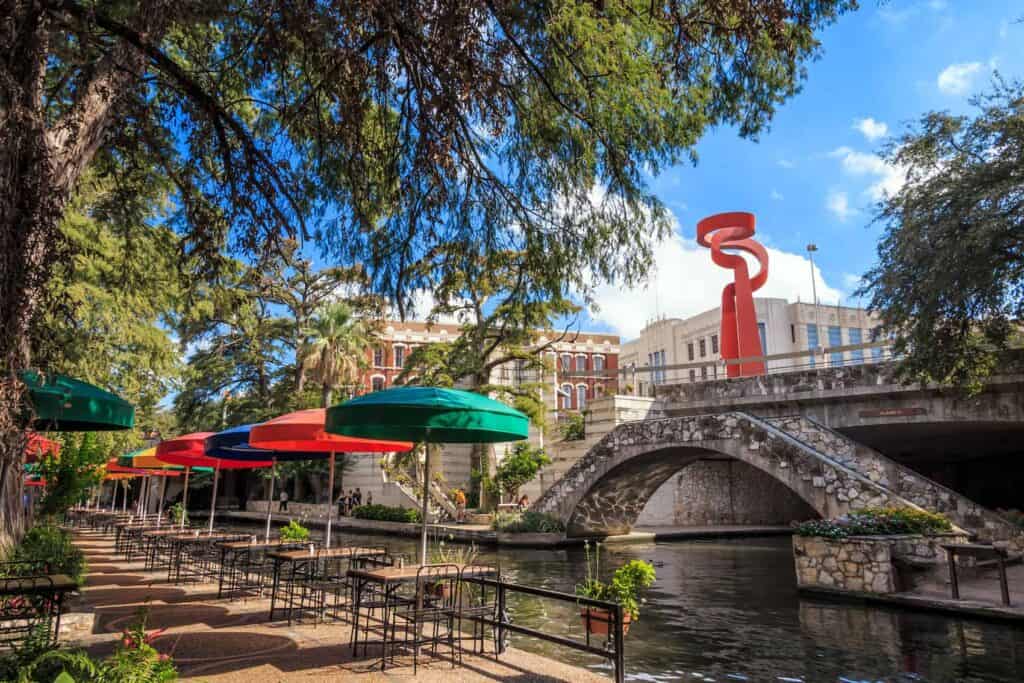
For some, continuously supporting their adult child is difficult. “I feel like it’s taking a toll on my mental and physical health…I’m still having to support my child that’s 18 or older knowing they can do good on their own,” one study participant wrote.

I do wish my 20-year-old son was more independent,” wrote another.

It’s worth pointing out that in Sandwich Generation families, care and support go both ways. Over half (57%) of Sandwich Generation adults are supported by their 65 or older parents socially, and 40% get help with kids.

Over a quarter (26%) of respondents in our survey receive financial support from their parents aged 65 or older, and 16% get help with the chores around the house.

Parents’ Health and Children’s Future: What Worries the Sandwich Generation Adults

Thinking about the next five years, members of the Sandwich Generation are primarily concerned about their aging parents, namely their physical health (73%) and cognitive function (62%)

For some, that problem remains in the future, but it still plays on the minds of those in the Sandwich Generation. “I don’t yet care for my parents but worry about their changing needs as they age,” wrote one respondent to our survey.

On a related note, nearly half (45%) are worried about having to find a care facility and being able to afford their care.

And because they have other family members to take care of, half (50%) of those surveyed worry about being able to juggle caring for both parents and their own kids and family members.

Of those who have children under 18, 35% are concerned about not having enough money to support them. Around a quarter worried their kids won’t be able to find a job (27%) or get into college (23%) when they grow up.

A quarter of respondents (24%) worry about having to continually support their adult children financially. As one respondent said, “We’re still paying for college for our 21-year-old and we’ll be glad when he graduates.

A further 15% worry their adult kids might move in with them. However, some are ready for this possibility and accept that may be necessary due to the broader situation in the country. “I’ll do what I need to do to help my babies,” said one adult in the Sandwich Generation we surveyed.

The kids need help though because the economy sucks,” admitted another.

See prices for local moving labor. Read real customer reviews. Easily book your help online.

Moving to Care: How Sandwich Generation Plans for Future Care Arrangements

Speaking of moving, almost two-thirds (63%) of Sandwich Generation members in our survey anticipate that either they or their parents will move in the next five years to be closer to each other

More than a quarter (26%) of the Sandwich Generation adults are considering moving their parents closer to them to better be able to give them the care they need. 24% are thinking about their parent(s) moving in with them, including 18% of those for whom it’d mean moving their parents across state lines

“It’s going to be a bit of a struggle I already foresee this,” one of the respondents noted. “However, they are my parents and were there for me as I grew into an adult so I shall be there for them.

Almost 1 in 5 (18%) are thinking about finding a care facility for their aging parents to move to, and as many as 12% are prepared to move in with their parents to care for them.

Miranda Marquit, a Consumer Advocate at HireAHelper and a member of the Sandwich Generation herself, recommends starting conversations with parents about their care sooner rather than later: 


It may be awkward and difficult to talk to your parents about care arrangements they don’t need yet, but…[h]aving a plan for their care helps bring everyone on the same page. It helps you, your parents, and other family members prepare for it mentally, emotionally, and financially. And even if you had this conversation once, it’s worth revisiting after a period of time, or if someone’s health, work, or financial circumstances have changed.” 


Care for parents isn’t the only factor driving potential moving intentions among people in the Sandwich Generation. Around 1 in 10 (11%) anticipate their aging parents moving in to save money on housing, while 8% might need their parents to help take care of children.

And while for some having family move in is hard to imagine, others are keen to take it on. As one of our study participants said, “I want to do what I can to help my family. I would move all my family in here if I have to. It’s not a burden at all!

“Rewarding but Tiring”: What It’s Like To Be in the Sandwich Generation

Much like their family status, the experience of being in the Sandwich Generation is, for lack of a better word, complicated

On one hand, most (61%) of the Sandwich Generation members we surveyed feel anxious and concerned about the future. “It is exhausting. I never know which direction I’m being pulled in. It is a daily struggle,” one of our survey respondents said. 

Then, there is the cost of caring for two generations of family members. Almost half (46%) of those we surveyed reported their financial situation getting worse, with around one-third reporting sacrificing their retirement savings in order to financially support their children or parents.

Also among the negatives is the effect on psychological well-being. Around 41% of our survey respondents said having to support both their children and parents had a negative impact on their mental health. Around a quarter said their social life (28%) or work (23%) have suffered.

But there are positives, too. Almost a third of Sandwich Generation members we surveyed (31%) believe their “sandwiched” status made their family life better, and 28% note a positive effect on their overall well-being.


“…women make up the majority of the Sandwich Generation (58%), while men account for 42%. Age-wise, two-thirds (66%) of those in the Sandwich Generation are in their 30s or 40s.”


Finally, despite the amount of time, money, and effort it takes to care for their family, it’s part of what fills the lives of those in the Sandwich Generation with meaning. 

I feel happy caring for both my parent and my children, because I feel the love of having a family,” one of our study participants wrote. Sure enough, 59% of respondents agree that caring for their children and parents makes them feel fulfilled and invigorated. 


Sources and Methodology

All data, unless otherwise stated, have been derived from the findings of the survey HireAHelper ran via Pollfish in August 2023. 
The survey used a sample of 1,000 adults (18+) living in the United States, who fall under the definition of being in the “Sandwich Generation”: 
  • Having at least one living parent aged 65 or older
AND
  • Having a child under 18, or a child over 18 who lives with them or whom they support financially
Survey results were weighted by age, gender, and income using data extracted from the American Community Survey’s five-year data, collected from ~120,000 households.
The overall percentage of adults in the Sandwich Generation was determined based on the percentage of adults in the representative sample of adults in the U.S. who satisfy the screening criteria to qualify as being part of the Sandwich Generation.
The percentage of adults in the Sandwich Generation in each state was estimated using: 
Other sources used in this study include WorldPopulationReview and Missouri Economic Research and Information Center.

Illustrations by Maria Trigueros
×

I'm Moving

Moving? Thinking about moving? Whether your move is off in the distance or you already have one foot out the door, you'll learn about everything you should expect through our useful how-to's, cool articles and much more. It's all specially curated for you in our "I'm Moving" section.
Explore
×

I'm a Mover

For rookies or veterans alike, our "I'm a Mover" section is filled with extensive industry news, crucial protips and in-depth guides written by industry professionals. Sharing our decade of moving knowledge is just one way we help keep our professional movers at the top of their game.
Explore