Migration reports are out in full force, including the famous United Van Lines yearly report.
But while United handles more moves annually than any other mover network in the country, their numbers are not definitive across the industry board.
North American, Atlas and Allied all see slightly – and in some cases, wildly – different results in their migration study results. Not a surprise, because as a Full Service move provider, United handles a somewhat different clientele compared to companies like ABF, U-Haul and PODS – companies whose numbers might look a lot different. Then there’s that little thing called the Census.
Yep, the state-to-state migration numbers for 2017 are out – and folks, we have new inbound state champions! Here are the results:
United Van Lines
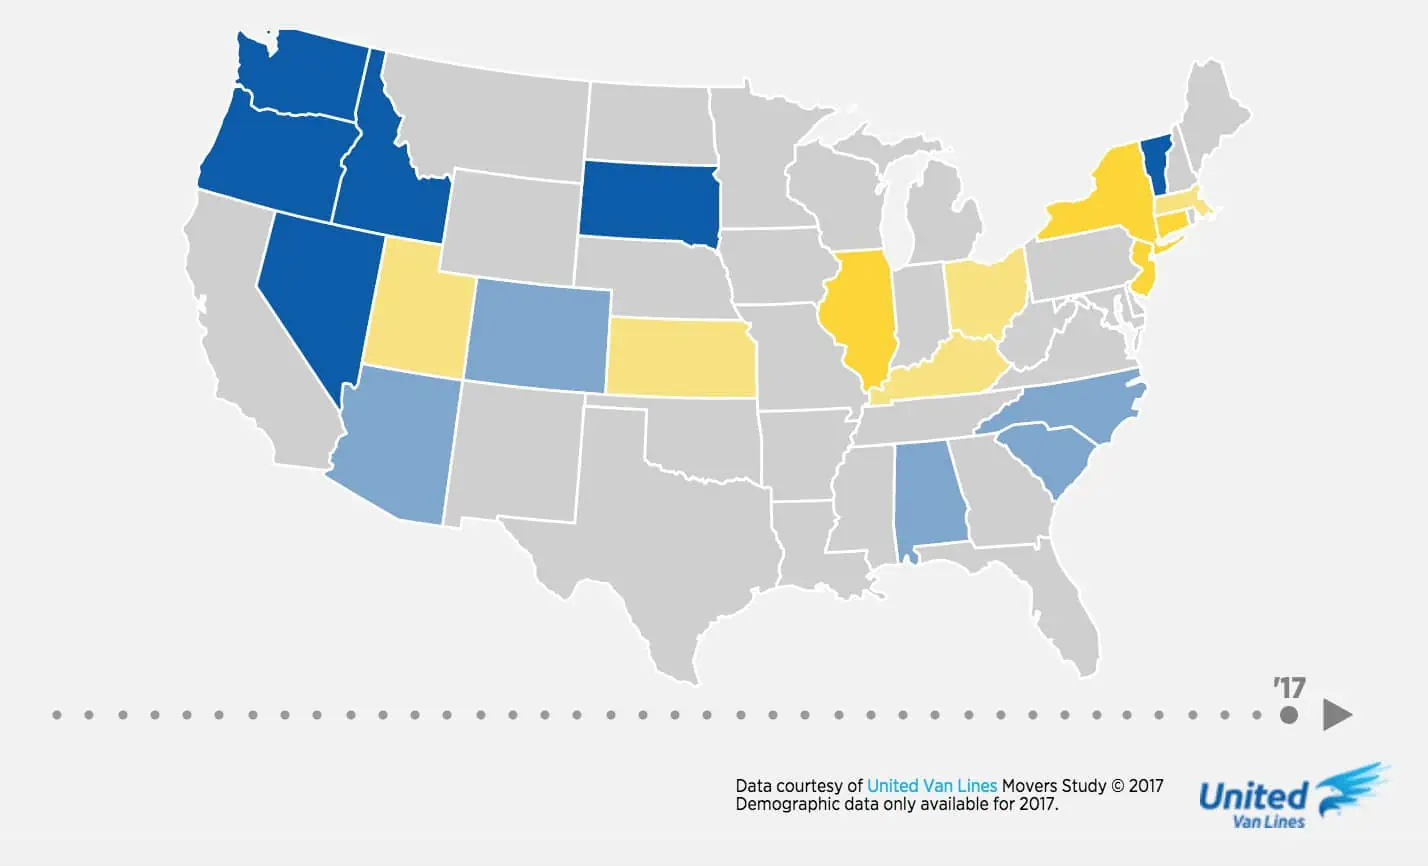
Vermont Takes United 2017 Inbound Crown
In 2015 they came in at third on the inbound rankings. In 2016 they inched their way up to number two. Now, this tiny state known mainly for skiing and maple syrup has captured the coveted top inbound spot on United’s 2017 National Movers Study.
Yes, the champagne is indeed flowing like syrup in Stowe, Killington and Montpelier as Vermont looks back on a year that saw a whopping 68% of their interstate moves coming in.
Reasons
According to United’s survey, “family” was the most common reason respondents gave for relocating to the Green Mountain State. Retirement, lifestyle and job also figured fairly evenly into the equation.
On the other hand, a full 75% of people moving out of state gave employment as their reason. This helps explain why half of all outbounders fell into the Under-35 age category – and another 25% were between 35 and 45 – while 40% of those moving into the state were 65 or older.
Those mountains may be green, but with those unemployment numbers, it looks like the valleys are starting to turn gray.
But before we start replacing all those ski lifts with wheelchair-friendly escalators, let’s take a step back and look a little closer at where the stats behind Vermont’s inbound crown come from. Keep in mind we don’t know how many moves Vermont actually saw by their report. (68% can be broken down to 17 inbound moves and 8 outbound moves – which hardly amounts to a mass migration to this land of wooden bridges and Bernie Sanders.)
Inbound:
1. Vermont
2. Oregon
3. Idaho
4. Nevada
5. South Dakota
6. Washington
7. South Carolina
8. North Carolina
9. Colorado
10. Alabama
This past year saw some familiar names on United’s Top Ten Inbound States list. Oregon, Nevada and North Carolina are all there, as they have been every year since 2011. Washington, Idaho, South Dakota, South Carolina and Arizona are also back after making 2016’s inbound list. Newcomers include Alabama and Colorado. Meanwhile, Florida has dropped off the inbound list after a strong three-year run.
This past year’s top inbound states are also fairly spread out around the country. The same cannot be said about United’s outbound states.
Outbound:
1. Illinois
2. New Jersey
3. New York
4. Connecticut
5. Kansas
6. Massachusetts
7. Ohio
8. Kentucky
9. Utah
10. Wisconsin
As with the previous few years, the major exodus seems to be coming out of the Northeast and the Midwest, with Utah adding a little “outbound yellow” to the otherwise blue western region on United’s interactive migration map.
Perennial outbound states New York, New Jersey, Connecticut and Illinois have been the most unfortunate ones; we’d have to go back to 2010 to see any of them as balanced. (New York and Connecticut were both spared the shame that year).
North American Moving Services
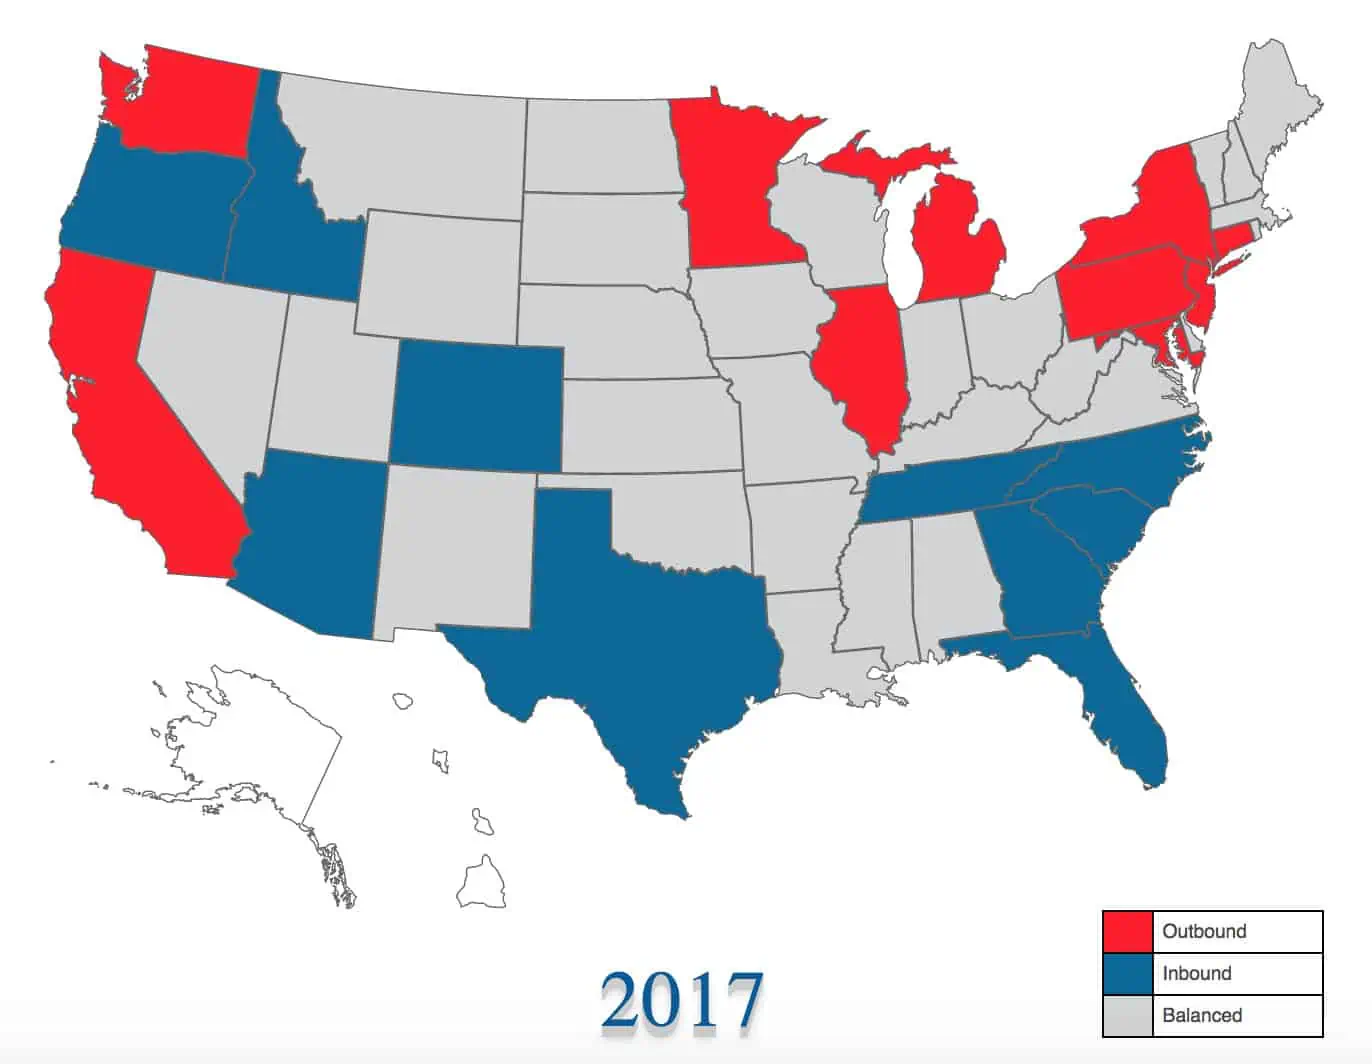
Arizona Takes North Americans 2017 Inbound Crown
North American’s inbound champ is Arizona, with 67% of their interstate moves coming into the Grand Canyon State. Other top inbounders not on United’s list include Tennessee, Florida, Georgia and Texas – all south and southeast states. (Those North American drivers must really love the south.)
Inbound:
- Arizona
- Idaho
- North Carolina
- South Carolina
- Tennessee
Outbound:
- Illinois
- Connecticut
- New Jersey
- California
- Michigan
Like United, North American has Illinois, New Jersey and Connecticut at the top of their outbound list (with New York a notable #8). But the rest of their top outbounders – California, Michigan, Pennsylvania, Minnesota and Maryland (#4-8 on the map) aren’t even on United’s radar.
Interestingly, North American’s #10 outbounder is Washington, which ranks #6 on United’s inbound list.
In accounting for these discrepancies, it is worth noting what North American says of their report’s methodology:
“We define the top inbound and outbound states as those that have the highest proportion of moves where the absolute value difference of inbound and outbound moves is greater than or equal to 400. This weeds out states that had a small number of moves but would have a high ratio of inbound/outbound moves.”
This may explain why United’s 2017 champ Vermont and #5 South Dakota (United’s #1 in 2016 by the way) aren’t anywhere on North American’s Top Ten.
Atlas Van Lines

Washington Takes Atlas 2017 Inbound Crown
Atlas Van Lines offers some relative surprises too. Idaho, Washington and Nevada as their top three inbounders may not raise any eyebrows. But Alaska, Maine and New Hampshire at #5, #6 and #10? Oregon is a familiar name, but seeing them at #8 seems in contrast to their recent United Van Lines inbound championships.
Atlas’s top outbounder, meanwhile, is Illinois (same as both United and North American – those Fighting Illini have a real stranglehold on that top spot!). And their #2, West Virginia, was a strong outbounder for United for six years straight before balancing out in 2017.
But Nebraska at #3? Nebraska has been balanced for United since 2001! And #4 outbounder South Dakota has been an inbound darling for United the past three years.
Rounding out the Atlas top outbound list are Hawaii, Indiana, Delaware and Louisiana, all of them somewhat surprising since three of them have spent the last ten years on United’s “balanced” register. Only Indiana has managed to make a blip on United’s outbound radar in that time frame.
Inbound:
- Idaho
- Washington
- Nevada
- Tennessee
- Alaska
- Maine
- North Carolina
- Oregon
- Alabama
- New Hampshire
Outbound:
- Illinois
- West Virginia
- Nebraska
- South Dakota
- Hawaii
- Indiana
- Delaware
- New York
- Louisiana
- Kansas
In contrast to the percentages United and North American provide, Atlas gives actual numbers of inbound and outbound moves for each state. Here we see that Vermont has seen just a fraction of the moves so many other states see, so it’s easy to imagine why they wouldn’t have made it onto North American’s list. (Meanwhile, once again, Canada’s Yukon Territory has seen zero moves. We’ll blame it on the roads.)
Allied Van Lines
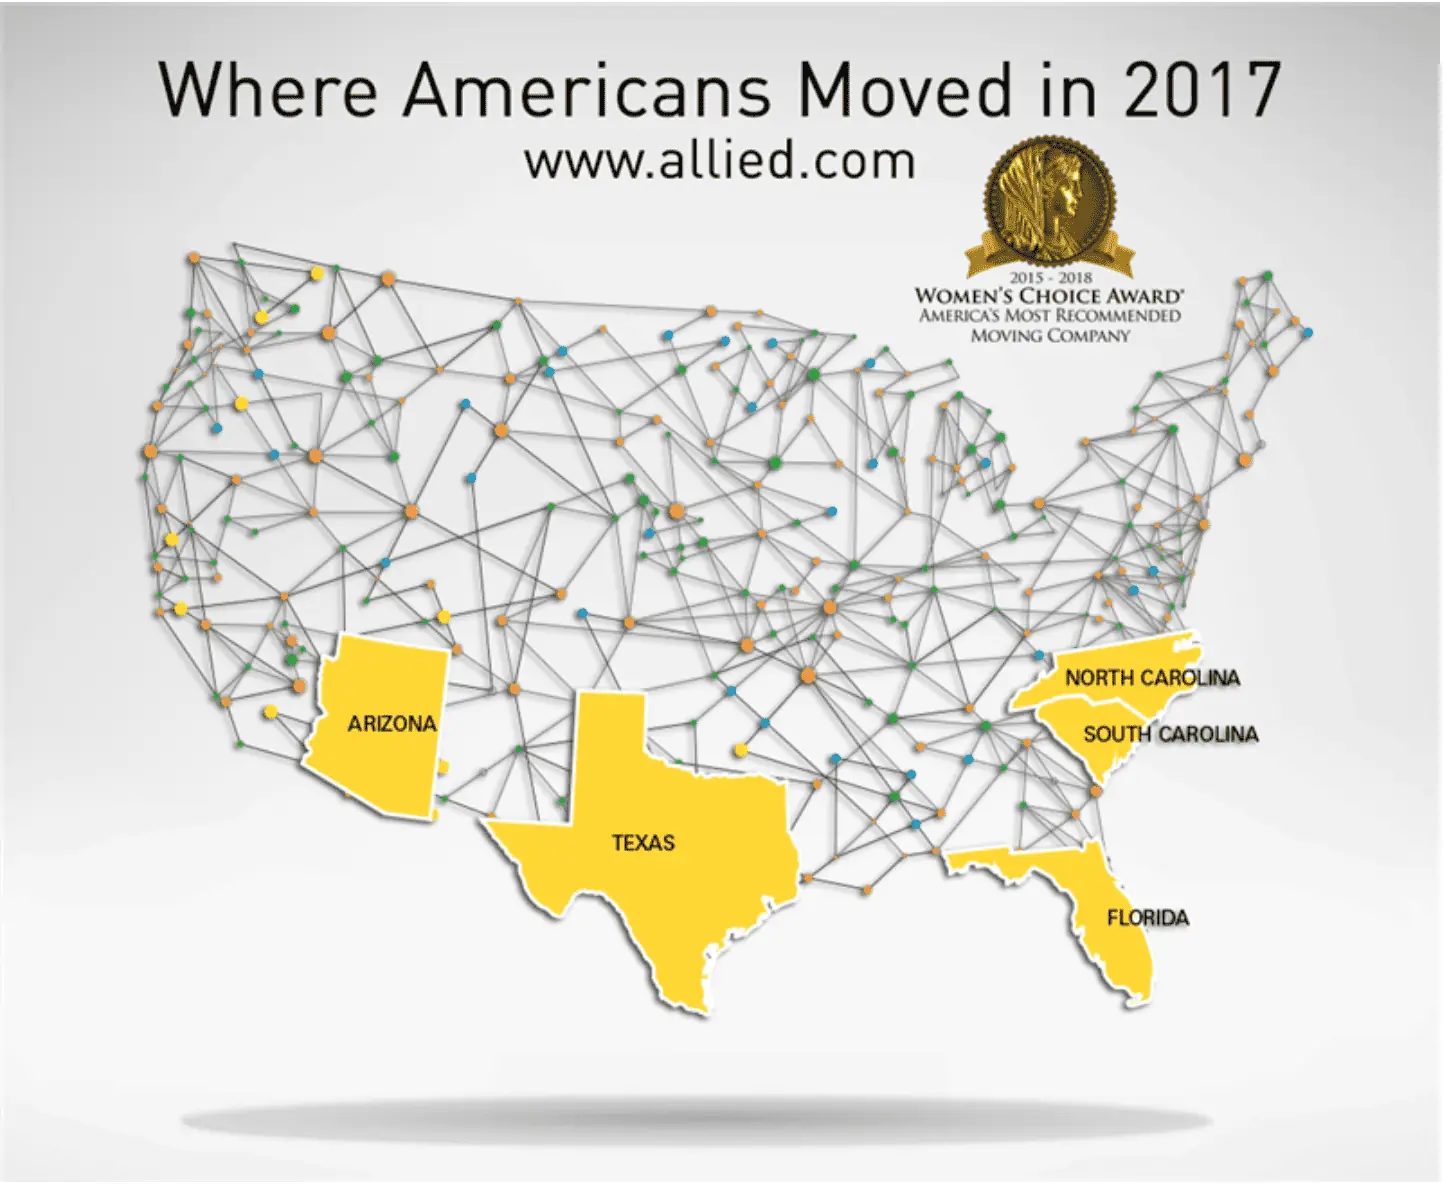
Florida Takes Allied 2017 Inbound Crown
Allied Van Lines keeps it all very short and sweet. They report only their top fives:
Inbound:
- Florida
- Arizona
- North Carolina
- South Carolina
- Texas
Outbound:
- California
- Illinois
- Pennsylvania
- New Jersey
- Michigan
Based on this limited report, we’re able to come to at least one solid conclusion: Allied’s drivers love moving people south even more than North American’s do.
U-Haul

Texas Takes U-Haul 2017 Inbound Crown
Because news outlets predominately focus on Full Service van lines, it can easily be argued this eliminates an entire sector of the migrating public. (In fact, Full Service van lines actually conduct less than half of all moves performed in the US every year.)
Do U-Haul’s numbers reflect what the van lines suggest are moving trends?
Nope.
Inbound:
- Texas
- Florida
- Arkansas
- South Carolina
- Tennessee
- Washington
- North Carolina
- Connecticut
- Colorado
- Vermont
Outbound:
- California
- Illinois
- Pennsylvania
- Michigan
- Massachusetts
- New Jersey
- New York
- Arizona
- Maryland
- Georgia
Texas tops U-Haul’s 2017 Growth States list. This shouldn’t come as a huge surprise, as Texas has fared well recently in the inbound-outbound game. In 2017 their inbound percentages with United, North American and Atlas were 54, 53 and 53, while Allied put Texas down as their fifth biggest inbound state.
Oddly, Texas won U-Haul’s Growth State crown by bringing in – get this – a whopping 50.3% of all one-way truck rental traffic crossing Texas’s borders. That’s right. Fifty. Point. Three.
This hardly lends a whole lot more understanding to the migration trends we’re trying to dissect. But here we are, so let’s keep moving.
U-Haul rounds out its top five Growth States with Florida, Arkansas, South Carolina and Tennessee. Yes, Arkansas – which has been balanced on United’s report 37 of the last 40 years. Then again, Arkansas remained balanced in 2017 on United’s ledger with a 54% outbound rate, so that they are U-Haul’s #3 Growth State is rather surprising no matter how minuscule their positive U-Haul balance might have been.
And who comes in at #8 on U-Haul’s list? That big loser with United and North American (but not with Atlas), Connecticut.
On the flip side, U-Haul has Colorado at #9 – exactly where United and North American have them.
United States Census Bureau
Idaho Takes United States Census Bureau 2017 Inbound Crown
Yes, the Bureau has all the moving numbers we could possibly want. So many, in fact, that it could take until next January to weed through them all.
But thanks to Business Insider we don’t have to.
In this piece with the strangely long title: While the Bureau considers “a variety of components” in determining what’s happening among the more than 325 million people who make up the US population, Business Insider brings us what we need: domestic migration.
Here we see the net population gain or loss for each state for 2017. Births, deaths and international immigration are not counted; this is simply and strictly an account of how many people moved into or out of each state. (Again, not moves, but individual people.)
Inbound:
- Idaho
- Nevada
- South Carolina
- Oregon
- Arizona
- Washington
- Montana
- Florida
- Colorado
- North Carolina
And in this, the winner is Idaho, with a net domestic migration gain of 14.6 people per 1,000 residents. In second place comes Nevada, with South Carolina, Oregon and Arizona rounding out the top five. The second half of the big ten winners are Washington, Montana, Florida, Colorado and North Carolina.
These results actually mirror the van lines’ findings to a striking degree. Only Arizona, Montana and Florida don’t show up in United’s top ten. Seven of the Census top ten are also on North American’s top ten. Unbelievably, Colorado is #9 on all three lists.
As for the Net Domestic Migration losers? Yes, Illinois is up there, but at #5, maybe this is the survey they should be talking about in Chicago.
Outbound:
- Wyoming
- Alaska
- New York
- Hawaii
- Illinois
- North Dakota
- New Jersey
- Connecticut
- Louisiana
- West Virginia
The big loser in the 2017 migration tournament is Wyoming, a surprise since the Equality State doesn’t show up on any van line outbound lists – or inbound for that matter. United had them at 53% inbound for 2017. North American had them at 54% in. Only Atlas has them as outbound – based on a grand total of 330 moves.
The Bureau’s next three biggest net migration losers are Alaska, New York and Hawaii. Alaska and Hawaii, neither of which show up anywhere for United or North American, are Atlas’s #5 inbound and #5 outbound, respectively. North Dakota, New Jersey, Connecticut, Louisiana and West Virginia complete the Bureau’s top ten.
Again, while there are outbound wild cards, we still see some consistency between the Bureau and the van lines. Atlas and the Bureau actually have seven migration losers in common between their top tens. Looking at the US Census Bureau’s Net Domestic Migration map we can clearly see the winners clustered in the south and west with the losers dominating the northeast and midwest.
What’s The Takeaway?
![]()
Remember, the numbers put together by each of the van lines represent the migration trends among the customers they’ve served. Van lines count moves, the Bureau counts people.
This may not account for the reason United’s inbound champion Vermont is somehow a net loser according to the Census Bureau’s numbers, but it does suggest that, despite the discrepancies, the van lines and the Census Bureau can give a decent overall on what is going on out there.
But in the cases where data remains too contradictory to be meaningful, evaluating regions rather than individual states might give us a slightly more reliable picture of the migration trends playing out across the US. At the end of the day, we are only looking at a mere slice of the American migratory pie.
There’s More Realistic Data Out There
We need another, more encompassing way to look at where America is moving to and from.
DIY Moves and Hybrid Moves (besides U-Haul), which by far and away are the more common ways to move, are sorely misrepresented. When you move, do you routinely call up $2,000+ movers? Have you ever saved money by having your friends move you? What are these Full Service reports actually reflecting?
That’s something to keep in mind when the local news sounds off on “moving trends” based off a single Full Service Moving company’s report.