2022 Study: Trends and Findings From Americans Moving to Mexico

Author:

Publish Date:

Last Modified Date:

Category: International Moving

Tags: Tags: , , , , , , , , , , , , , , , , , , , , , , , , ,

Key Findings

  • The number of U.S. citizens moving to Mexico in 2022 is set to reach 18,161 — the highest in nearly a decade 
  • More than half (52%) of Americans who moved to Mexico in 2022 were retirees
  • Jalisco and Mexico City attract nearly a third (31%) of all U.S. citizens moving to Mexico 
  • Rent is two times lower than in the United States, on average
  • There was an avg. of 1,870 monthly Google searches for “moving to Mexico” in 2022 — a 42% YoY increase
  • North Carolina (+75%), Texas (+65%), and Florida (+60%) saw the greatest YoY increases in Google searches for “moving to Mexico”

The number of Americans moving to Mexico over recent years is estimated to be between 800,000 and 1.5 million. And lately, that number has been growing rapidly.

Americans leave the country for any number of reasons: relaxed COVID restrictions, affordable housing, affordable healthcare and social care, greater conditions for remote work, warm climate, amazing food, rich and varied culture, and the list goes on. Mexico has all of these things, and it’s right next door.

But what is the cost to the country? The influx of immigrants with higher incomes is reportedly having adverse effects on the local population; there are reports of gentrification in Mexico City, rents doubling in Tijuana, and foreign demand driving up prices in Quintana Roo and Baja California Sur — all places that are among the top destinations for Americans settling into Mexico.

Let’s dive into the numbers and see just how many Americans have moved to Mexico in 2022.

Going South: Migration to Mexico To Reach New Heights in 2022

As reported in our recent study of Americans moving abroad, 10,594 U.S. citizens have taken residence in Mexico so far in 2022.

Not only is that 22% higher than by the same time last year, but at this rate, it’s estimated 18,161 Americans will have moved to Mexico by the end of 2022. That figure is higher than in any year since 2013.

When looking at this trend in more detail, the number of temporary residents (as opposed to permanent residents) has increased sharply. Temporary residents are defined as people who intend to stay in Mexico for longer than 180 days for the stated purposes of either work, study, reunification with family or business ventures.


“… it’s estimated 18,161 Americans will have moved to Mexico by the end of 2022. That figure is higher than in any year since 2013.”


Already in 2021, over 9,000 U.S. citizens have successfully applied for a temporary residency in Mexico; that’s the highest number of applications over the last decade!

By the end of this year, Mexico is on track to receive 10,780 Americans as new temporary residents.

Jalisco — Not Mexico City — Is the Top Destination for American Immigrants

There is certainly a lot of buzz about Americans moving to Mexico City, but it is the state of Jalisco that consistently sees more U.S. citizens moving in than Mexico’s capital… or any other state for that matter.

american migration

Over 2,000 Americans have moved to Jalisco in 2022, and that figure is likely to reach 3,400 people by year’s end. That would mean nearly one in five (19%) Americans moving to Mexico choose to move to Jalisco, a West Coast city.

The nation’s capital, Mexico City, isn’t too far behind Jalisco. Mexico City has seen 1,315 American move-ins so far in 2022, with 2,254 projected by year’s end (~12% of the total migration). Baja California Sur also ranks high, with an estimated 1,867 new residents from the United States, (~10% of the total inflow).

Another state that seems to be fast becoming a popular destination is Quintana Roo

Best known for being home to Cancun, this state is beginning to attract Americans looking to live (and not just party) there. In 2022, Quintana Roo is projected to attract nearly 13% of all moves from the United States — that’s second only to Jalisco.

Taken together, these four states receive the majority (54%) of all Americans moving to Mexico.

Moving far away?

Do it cheaper.


MovingPlace can save up to 40% compared to traditional interstate moving companies. Click here to learn how.

Remote Work? More Like Retirement! Most Common Reasons for American Immigration to Mexico

Since 2012, almost a third (31%) of all Americans who moved to Mexico as temporary or permanent residents reportedly did so for work. That’s based on the official immigration statistics which group all new residents into categories of “work”, “family reunification”, “retirement”, and “other”. 

An additional 23% of immigrants from the United States get their resident permits in Mexico by being a family member of either a Mexican national or another U.S. citizen who already has a valid residence permit.

The most popular category of permits issued to Americans is called “rentista” – which is the most common route to residency for retirees.

In the last decade, 40% of all U.S. citizens who took up residency in Mexico were retirees; this year, that share has jumped to 52%. In other words, over half of all Americans moving to Mexico are reportedly doing so during their retirement. This might suggest U.S. cost of living is having an impact on social security stability as well.

Tourists or Residents?

And what about that segment of American remote workers whose moves to Mexico have been subject to much discussion and debate

As the number of U.S. citizens moving to Mexico is setting new records, in some parts of Mexico, calls for Americans to go back home are beginning to be heard.

mexico american immigration

While Mexico does offer a Temporary Resident Visa for remote workers under the Financial Solvency clause, official statistics don’t distinguish these types of residents from other temporary resident holders. It is likely that they are bundled into the “Other” category, which also covers people relocating for scientific research, government work and more.

Iit’s reasonable to assume remote workers who are giving Mexico a go are likely making use of Mexico’s easy-to-obtain tourist visas, which allow immigrants to stay in the country for up to six months.

Summer Spike: Searches for Moving to Mexico Peaked in June 2022

The data show no sign of American immigration slowing down anytime soon. On top of the growing number of recorded moves, moving intent (signified by Google searches for “moving to Mexico”) is the highest it’s been in years.


“…there wasn’t a single state that didn’t increase their Googling of Mexico.”


From 2019 to 2021, the number of monthly Google searches for “moving to Mexico” tended to stay between 1,500 and 2,000. 

By the middle of 2022, however, these searches reached 3,100. Though it’s not simple to know the causation, that spike correlates with the U.S. Supreme Court’s overturn of the precedent-setting Roe v. Wade decision, as well as 9.1% currency inflation in America its highest rate in 40 years. 

Where in America ‘Moving to Mexico’ Searches Peaked

The average number of monthly Google searches in America for “moving to Mexico” rose roughly 36% year-over-year, reaching 2,100 searches in 2022 — that’s up an average of 1,550 searches.

Overall, there wasn’t a single state that didn’t increase their Googling of Mexico; all states saw greater search volume for “moving to Mexico” this year as compared to 2021.

Some states, however, stand out. In North Carolina, there was a 75% increase in Google searches for “moving to Mexico”. Searches also jumped 65% in Texas and 60% in Florida, respectively.

By contrast, California, where the number of “moving to Mexico” searches is the highest in the country, only saw a Google search increase of 15% in 2022, as compared to last year.

Moving far away?

See prices for container labor – instantly.

Read honest customer reviews.

Book everything online.


All About Affordability: Why Mexico Attracts Expats From Around the World

Mexico is finding itself to be a magnet not only for Americans, but for expats across the globe.

In its Expat Insider 2022 report, Inter Nations — an expat community hub — named Mexico the number one country for expats. Among the aspects that propelled it to the top spot are “affordability” and “ease of settling in”, which both listed Mexico as the very best in the world.


“It’s reasonable to assume remote workers who are giving Mexico a go are likely making use of Mexico’s easy-to-obtain tourist visas, which allow immigrants to stay in the country for up to six months.”


Affordability of housing and medical care are also likely to attract Americans; both are increasingly unaffordable for vast strands of the U.S. population.

Healthcare

A survey commissioned by ExpatsInMexico – an online magazine for foreigners living in Mexico – found that for 75% of expats, $150 per month covers all of their healthcare needs. It’s an attractive proposition for retirees, who make up 80% of the survey respondents and are likely to spend twice that amount, at minimum, if they remained in the United States.

Rent

Rent is another big immigration factor. When in the United States, the average rent is now over $2,000, and growing in over 90% of U.S. cities, the average rent in the four states of Mexico that are top destinations for U.S. immigrants is below $800.

Of the four top destination states, rent is lowest in Jalisco ($720 per month) and Quintana Roo ($735). Rent is slightly higher in Mexico City ($787), and noticeably higher in Baja California Sur ($925). (All figures are expressed in average dollar amount after conversion.)

Sure enough, the houses and apartments Americans moving to are likely to be at the higher end of the price spectrum. But if you consider that most Americans moving to Mexico are retirees, rents this low must be extremely appealing, even if they sold their homes to make the move.


Sources and Methodology
Official immigration statistics come from the Unidad de Política Migratoria – Boletines Estadísticos and were used to estimate the number of Americans moving to Mexico. Only moves requiring either a temporary or a permanent work permit were counted. Military moves were excluded, as were the moves for temporary purposes, such as business and tourism.
The total and average monthly search volumes for the keyword “moving to Mexico” were taken from Google Ads API.
Rent prices for Mexican cities were sourced from Propiedades.com, while the estimates of average rents in the U.S. were taken from Redfin


Illustrations by Lauren Ibañez

Moving During Delta: How COVID Affected American Moves in 2021 (so Far)

Author:

Publish Date:

Last Modified Date:

Category: Moving Advice, Moving Stories

Tags: Tags: , , , , , , , , , , , , , , , , , , , , ,

Key Findings

  • 21% of people who moved from January through July 2021 said they moved due to COVID-19
  • During the first three months of 2021, every third move was due to COVID-19
  • 37% of COVID-related moves were people moving due to going remote
  • One-in-five (22%) moved after selling their home in a favorable real estate market
  • Around 18% moved because they didn’t feel safe where they lived
  • 17% moved because they couldn’t afford their housing and had to relocate
  • For the first time in years, more people moved into New York City (+51%) than left it


When we looked at how Americans moved during the pandemic at the end 2020, people reported about one-in-four moves were due to COVID. Moreover, most of those surveyed who said they moved due to COVID were driven by concerns for personal health and safety, financial hardship, and the need to take care of family.

How have things changed in the world since? Well, 2021 has been an ever-shifting landscape for moving so far.

delta covidA rapid rise in vaccinations at the start of the year was followed by a dramatic drop in the number of cases, as people started seeing friends and family socially again and public life began to reopen. And yet in July, despite the 52% majority of Americans being fully vaccinated, cases and hospitalizations were on the rise again, and today, there is even talk of a fourth wave.

Meanwhile, among factors directly related to public health, employers are deciding whether to go fully remote or to ask everyone to go back to the office (or go for something in-between). Elsewhere, the real estate market continues to exceed all expectations as prices climb higher than ever and homes are selling at a record pace.

Okay, so how have these recent events affected the way Americans move? To find out, we analyzed a sample of over 57,000 related moves booked through HireAHelper.com and our partners from January through July of 2021. We also surveyed these customers to understand why Americans said they moved throughout 2021.

Defying Delta: Americans Continued to Move at 2019 Rates Despite Ongoing Pandemic

During this time in 2020, overall moving came to an almost grinding halt. Likely due to a fear of infection, many opted to move by themselves, booking activity was low, and cancellations were through the roof. 

As we found out through the data later, many moves simply ended up being postponed for later in the year when it was safer. Towards the end of 2020, the overall number of yearly moves actually evened out as the busy summer “moving season” shifted towards the end of the year.

In 2021, we have a different story on our hands. As the number of newly discovered COVID cases dropped, the number of moves grew at a slow but steady pace. Then, as national vaccinations began to pick up the pace, so did the moves. By April-May 2021, many more Americans were moving than the year previous.

This trend continued into the summer months, despite the surge of the Delta variant, otherwise known as the latest variant of the coronavirus which became the dominant strain in the U.S. in early July.

Whether due to the proliferation of the vaccines, the unwillingness to postpone moving plans any longer, or just harsh economic realities, Americans seem to be moving much more actively in 2021 so far. 

Get Help Unloading Your Rental Truck

See prices for movers by the hour—instantly.

Read real customer reviews.

Easily book your help online.


Remote Work, Real Estate, Return to Safety: Why Americans Said They Moved in 2021

As noted at the top of the article, 21% of moves made by our customers in 2021 were due to COVID-19, and more specifically the Delta variant.

That’s somewhat down from 25% at the end of last year, but still higher than the 15% of moves forced by the COVID pandemic we saw in early 2020.

Apart from being fewer in number, other things different about this year’s COVID-related moves are the reasons behind them.

In mid-2020, people who moved because of COVID claimed they did so out of financial hardship, to be closer to family, or due to feeling unsafe where they lived. By the end of 2020, the top reasons were similar: feeling unsafe, loss of job or income due to COVID, taking care of family.


“Financial hardship and concerns for safety gave way to remote work (37%) and taking advantage of the housing market by selling a home (22%) as the top COVID-related reasons to move in 2021.”


This year, however, things changed. Financial hardship and concerns for safety gave way to remote work (37%) and taking advantage of the housing market by selling a home (22%) as the top COVID-related reasons to move in 2021. 

This isn’t to say that concerns for health and safety are completely gone. Almost all COVID-related moves still happen for those very reasons, but the shift is clear. In 2020, pandemic-related moves were about sheltering in place to adapt to the new reality. In 2021, Americans seem to be making the most of the opportunities the pandemic presented despite all the hardship it brought about.

The Change of Reasons: Covid-related Reasons for Moving Throughout the Year

Sure, across seven months, many people moved to work remotely or after selling their homes in the booming real estate market. But that’s not always been the case in 2021. Let’s look at the most common COVID-related reasons for moving in 2021, over time.

Feeling unsafe due to COVID spread held at 10% of all pandemic-affected moves for five months, dipping to as low as 5% in June. But then the Delta variant happened. By July, as many as 15% of all pandemic-related moves were people concerned for their safety from the rapidly spreading infection.

Moving to work remotely is the reason that only became more common as the months went by, accounting for roughly 20% of all COVID-related moves in 2021. Selling a home peaked in May-June time, when this reason contributed to 15% of all COVID-related moves.

One reason that became less and less common as the year 2021 went on is moving due to losing jobs and income to COVID. Last year, as many as 35% of moves forced by the pandemic were down to financial hardship. In July 2021, financial hardship only accounted for 8% of stated reasons for a move.

Back to the Office? New York City Had More People Move in Than Out for the First Time in Years

We’ll leave the traditional review of where people are moving to and from for our annual report, but there was one curious finding that emerged from our analysis of moves in 2021 thus far.

According to the data, reports in the media, and figures from other companies in the moving industry, one trend always shines through; when you look at America’s biggest cities, such as New York, Chicago, Los Angeles, San Francisco, more people typically leave them than move in.

This has been true for years, but now we may have an exception on our hands. 51% more people moved to New York City than left New York City in the first seven months of 2021. 

In fairness, except for NYC, all the other major U.S. cities are showing the same trend they have in recent years—more people are leaving them than moving in. 

Whether this is a sign of an impending “big return to the office”, an indication that people started feeling safer, or a blip in the data remains to be seen. (We’ll round up all the moving trends in our annual report, likely to be published in January 2022.)

Return to Normal? Moving in 2021 Looks More Like It Did Before the Pandemic

Not only are people actively moving again, how and when they’re doing it resembles pre-pandemic patterns more than it does last year’s trends.

Take when people move, for example. In 2020, due to the spread of COVID-19, many people were forced to either cancel or postpone their move. This is why we saw 30% fewer people moving during “peak moving season” of May-July and 30% more in September-October time.

That’s not what 2021 looks like so far. If we look at when people moved this year and compare it to the last two years, we’ll see that the 2021 curve resembles 2019 a lot more than it does 2020. 

Another indication that moving in 2021 looks a lot more like 2019 than 2020 is how big the moves are again.

In 2020, likely due to many moves headed towards temporary, smaller accommodation, the size of an average move stood at 1,595 square feet, down by 282 square feet from 2019. 

But in 2021, the moves are big again—bigger than 2019 in fact. A typical move so far in 2021 was 1,793 square feet.


Based on the data, it looks like despite the surge of the Delta variant (or possibly in tandem with it), Americans moved in larger numbers in 2021 than in 2020 thus far.

As coronavirus continues to mutate and the overall vaccination pace slows, it’s impossible to predict what’s going to happen in the coming months. Whether moves will continue unimpeded or we’ll be forced to slow down and shelter-in-place again remains to be seen.

One thing we know for certain is that protecting your health and safety is still critically important when moving. If you are thinking of moving, be sure to check out our guides to moving during the pandemic and when states reopen to make sure your move goes safely, as well as smoothly. 

2021 Mid-year Moving Stats Infographic

covid infographic

Sources and Methodology
HireAHelper’s COVID Moving Study analyzed moving data in the U.S. booked through our online platform in 2021. Year-on-year comparisons of moving activity between 2021, 2020, and 2019 cover the period of January 1st through July 31st 2021.
Unless otherwise stated, all percentages, breakdowns, and summary statistics are derived from the data captured by HireAHelper.com and its partners.
Data on reasons why Americans moved came from HireAHelper customer surveys conducted in July 2020, December 2020, and September 2021.
Illustrations by Chelsea Beck

Millions Moved During Covid, Here’s How That’s Working Out

Author:

Publish Date:

Last Modified Date:

Category: Moving Advice

Tags: Tags: , , , , , , , , , , , , , , ,

While lockdowns kept us in one place during the COVID pandemic, many Americans still moved during this global crisis—many, because of it.

Among those surveyed who moved in 2020, 25% report their move was due in some part to the pandemic, per the HireAHelper American Migration Report. Respondents say their reasons for moving varied, from financial hardships, to downsizing their living arrangements, to a growing need to look after their families.

While we’re still in the middle of a pandemic, the U.S. appears to be on a path to recovery. Many Americans are choosing to get vaccinated (though the percentages remain alarmingly skewed by political affiliation), lockdowns and mask mandates have lifted in many communities, and employees are returning to previously closed worksites.

Looking back over the span of the pandemic thus far, how have so-called “pandemic moves” worked out for those who made them?

To find out, HireAHelper spoke to people who moved during the pandemic to get a closer look at the unique obstacles and opportunities that drove their decisions to move.

The Challenges of Deciding to Move During COVID

A pandemic hardly creates the ideal circumstances for a dream move. Those who moved due to situations caused by COVID were slightly more likely to have regrets about their move (31%) compared to those who moved for other reasons (30%). (See the data here.)

But while there were many reported negatives to moving in 2020, it’s not all regrets, either. People reported many ways the pandemic changed the landscape of their lives overnight, including ways that introduced new pressures, challenges, and obstacles—as well as rare and fortuitous opportunities. 

The Tense Household Relationships

As lockdowns took effect, many households reported their living arrangements were thrown into chaos and upheaval.

College students and adult children moved back in with their parents. Parents of young children struggled without child care. Couples who were now working from home together suddenly had to navigate being officemates, as well as roommates and partners


“Among those surveyed who moved in 2020, 25% report their move was due in some part to the pandemic.”


“I wasn’t doing well at home in quarantine,” admits Darlena Phan, a 26-year-old accountant. She and her fiance were living with her parents in order to save money. This placed them in Huntington Beach, CA when the government COVID lockdowns began. “Not sure why, but the family dynamics really deteriorated and I couldn’t stand being around my parents 24/7 anymore.” 

Darlena and her fiance had been saving towards a down payment to buy a home in 2022. But these new family conflicts pushed the couple to consider sliding their move date up, despite their unreadiness.

Others found their partnerships were struggling to bear the new pressures of pandemic living. Dating site Dating.com reports that two-thirds of its current users experienced a breakup in 2020. 

Dannie Fountain, an HR professional living in Chicago, began the lockdowns living with her then-partner. But the mounting pressures and stress associated with the pandemic led the romantic partnership to “implode,” Dannie says. By May 2020, the relationship was over, and Dannie was forced into actively searching for her own place.

Reported Uncertainty Around Work Arrangements

Moving during the COVID-19 pandemic also meant making big work decisions—without the usual information needed to do so.

Those considering a move reported having to navigate unclear remote work policies, worries about furloughs and layoffs, and even uncertainties around unemployment benefits.

With work and living arrangements disrupted and thrown up in the air, people considering a move were left to make that decision based on nothing more than guesswork. 

Maxwell and Steph Miller had long wanted to move out of Utah to a more progressive state, where they hoped to also buy a home. When Maxwell’s job as a web developer transitioned into a work-from-home position, they saw an opportunity to finally make the move of their dreams: relocating to the northwest, to Vancouver, WA. 


“Her breaking point came after a ‘huge’ Halloween party another tenant held in the courtyard, with no masks and counter to citywide safety precautions.

‘I needed to leave the apartment to go grocery shopping, and literally had to walk by at least 20 people in close-body contact,’ she says.”


But while Maxwell’s employer committed to remaining remote through summer 2021, the work-from-home policy was still temporary with no permanent exceptions. This complicated the home buying process for the Millers when their loan was outright denied due to the company’s unclear policy. 

“Everything about this move has been out on a limb,” Maxwell says. “There have been no guarantees.” Though the couple was able to secure lending to buy their townhome shortly thereafter, there remains a chance Maxwell’s employer could end its remote policy—leaving him looking for a new job in a new city.

Fountain faced similar frustrations when shopping for an apartment after her breakup. Her employer now operated remotely, and originally planned to be back in-office by July 2020. Because of the open-ended remote work policy, Dannie prioritized commutability when searching for an apartment—even though she has not been required to return to the office since.

COVID Safety Concerns and Measures

covid moving
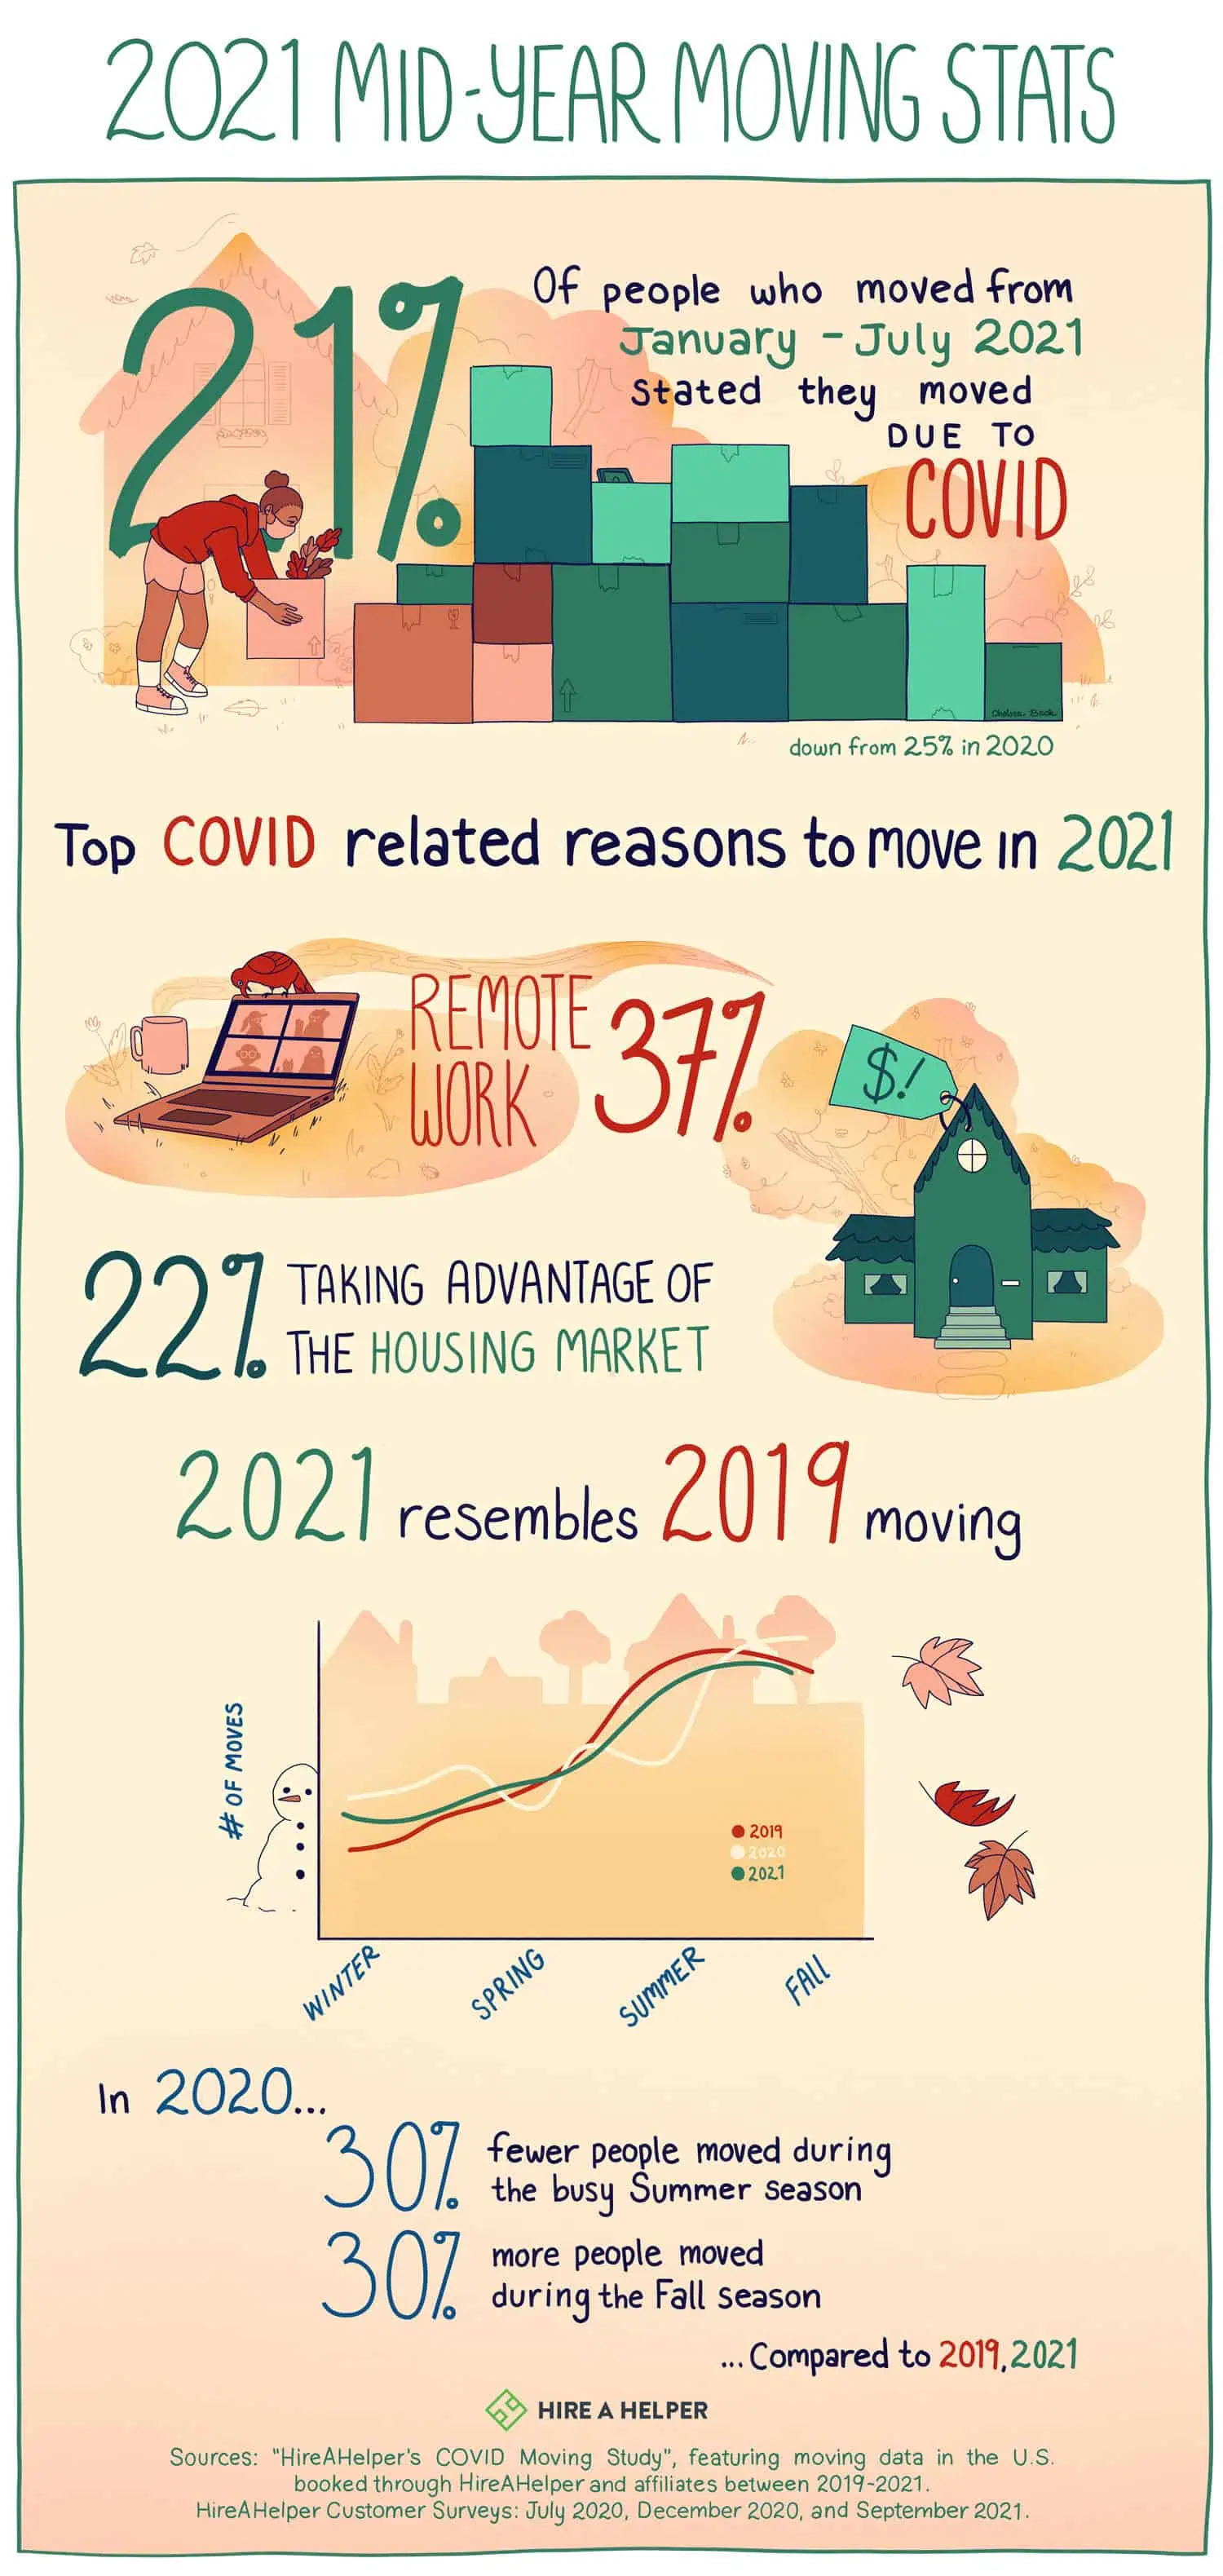
Of course, much of the impact of the pandemic was related to the virus itself, and the safety concerns it introduced. Among those surveyed who moved due to COVID in 2020, 13% reported being spurred on by feeling unsafe in their current locations due to the spread of COVID

It was this feeling of unsafety that led Fountain to her second Covid-related move—just six months after her first. As a young professional, she had chosen a cohabitated apartment complex with a private room, yet shared common spaces. 

Within a few weeks of moving in, however, Dannie realized her complex was not enforcing COVID safety regulations. Due to this, she often felt uncomfortable leaving her room to use the shared living spaces, unsure if she could maintain a safe distance from roommates, or if the rooms were being properly sanitized. 

Her breaking point came after a “huge” Halloween party another tenant held in the courtyard, with no masks and counter to citywide safety precautions. “I needed to leave the apartment to go grocery shopping, and literally had to walk by at least 20 people in close-body contact,” she says. 

Dannie complained to the property managers and was told there was nothing they could do. She decided it was time to look for a new, safer situation—she found a new apartment by November 2020, months later.

The Hidden Opportunities of Moving During COVID-19

Dannie, Darlena and Maxwell all expressed that moving during COVID was more stressful. But this crisis also opened up rare opportunities to achieve their goals, including moving to their dream locations, or buying their first homes. 

While the economy as a whole struggled in 2020, many individual households reported being financially healthy during the pandemic. Stimulus checks and expanded unemployment benefits boosted some households’ cash savings. On top of that, historically low interest rates on homeownership in America made this a prime time to get a mortgage, while many housing markets offered previously unheard-of deals on rental rates.

Fountain dreamed of living in a specific, well-located, higher-end apartment complex in Chicago. But with studio apartments leasing for $3,000 per month within this complex, it was simply outside her budget, pre-pandemic.

After her first COVID move, however, Dannie decided to check again and discovered the rental rates of this apartment complex had dropped 60% to just $1,200 a month. Thrilled, Dannie signed a lease—and her dream apartment became her reality.

For Darlena Phan and her fiance, low mortgage rates made it possible to buy their first home in Riverside, CA earlier than planned. “We only had 10% down, but we calculated that we would save more money with the lower interest rate than (by) avoiding (private mortgage insurance),” she points out.

Government stimulus checks helped boost Maxwell and Steph’s savings, and new remote work policies made it possible for them to qualify for a mortgage without switching jobs. Combined, these unique circumstances gave the Millers room to plan and pay for their move across state lines, a situation not possible before COVID-related policies.

The relocators we spoke to largely agreed that their decisions to move, even during COVID, were worth it. People moving by and large report that their COVID-timed move was a net positive; among those surveyed who moved during the past year, 82% say it improved their life for the better.

“It was 100% worth it because the cost of everything has simply gone up,” Maxwell admits. “If we hadn’t done it then, it would never have happened.”


Illustrations by Tara Jacoby

Every Major Moving Report of 2017 Analyzed: Where Is Everybody Going?

Author:

Publish Date:

Last Modified Date:

Category: Moving Industry News

Tags: Tags: , , , , , , , , , , , , , , , , , , , , , , , , ,

Migration reports are out in full force, including the famous United Van Lines yearly report.

But while United handles more moves annually than any other mover network in the country, their numbers are not definitive across the industry board.

North American, Atlas and Allied all see slightly – and in some cases, wildly – different results in their migration study results. Not a surprise, because as a Full Service move provider, United handles a somewhat different clientele compared to companies like ABF, U-Haul and PODS – companies whose numbers might look a lot different. Then there’s that little thing called the Census.

Yep, the state-to-state migration numbers for 2017 are out – and folks, we have new inbound state championsHere are the results:

United Van Lines

Vermont Takes United 2017 Inbound Crown

In 2015 they came in at third on the inbound rankings. In 2016 they inched their way up to number two. Now, this tiny state known mainly for skiing and maple syrup has captured the coveted top inbound spot on United’s 2017 National Movers Study.

Yes, the champagne is indeed flowing like syrup in Stowe, Killington and Montpelier as Vermont looks back on a year that saw a whopping 68% of their interstate moves coming in. 

Reasons

According to United’s survey, “family” was the most common reason respondents gave for relocating to the Green Mountain State. Retirement, lifestyle and job also figured fairly evenly into the equation.

On the other hand, a full 75% of people moving out of state gave employment as their reason. This helps explain why half of all outbounders fell into the Under-35 age category – and another 25% were between 35 and 45 – while 40% of those moving into the state were 65 or older.

Those mountains may be green, but with those unemployment numbers, it looks like the valleys are starting to turn gray.

But before we start replacing all those ski lifts with wheelchair-friendly escalators, let’s take a step back and look a little closer at where the stats behind Vermont’s inbound crown come from. Keep in mind we don’t know how many moves Vermont actually saw by their report. (68% can be broken down to 17 inbound moves and 8 outbound moves – which hardly amounts to a mass migration to this land of wooden bridges and Bernie Sanders.)

Inbound:

1. Vermont
2. Oregon
3. Idaho
4. Nevada
5. South Dakota
6. Washington
7. South Carolina
8. North Carolina
9. Colorado
10. Alabama

This past year saw some familiar names on United’s Top Ten Inbound States list. Oregon, Nevada and North Carolina are all there, as they have been every year since 2011. Washington, Idaho, South Dakota, South Carolina and Arizona are also back after making 2016’s inbound list. Newcomers include Alabama and Colorado. Meanwhile, Florida has dropped off the inbound list after a strong three-year run.

This past year’s top inbound states are also fairly spread out around the country. The same cannot be said about United’s outbound states.

Outbound:

1. Illinois
2. New Jersey
3. New York
4. Connecticut
5. Kansas
6. Massachusetts
7. Ohio
8. Kentucky
9. Utah
10. Wisconsin

As with the previous few years, the major exodus seems to be coming out of the Northeast and the Midwest, with Utah adding a little “outbound yellow” to the otherwise blue western region on United’s interactive migration map.

Perennial outbound states New York, New Jersey, Connecticut and Illinois have been the most unfortunate ones; we’d have to go back to 2010 to see any of them as balanced. (New York and Connecticut were both spared the shame that year).

North American Moving Services

northamerican.com

Arizona Takes North Americans 2017 Inbound Crown

North American’s inbound champ is Arizona, with 67% of their interstate moves coming into the Grand Canyon State. Other top inbounders not on United’s list include Tennessee, Florida, Georgia and Texas – all south and southeast states. (Those North American drivers must really love the south.)

Inbound:

  1. Arizona
  2. Idaho
  3. North Carolina
  4. South Carolina
  5. Tennessee

Outbound:

  1. Illinois
  2. Connecticut
  3. New Jersey
  4. California
  5. Michigan

Like United, North American has Illinois, New Jersey and Connecticut at the top of their outbound list (with New York a notable #8). But the rest of their top outbounders – California, Michigan, Pennsylvania, Minnesota and Maryland (#4-8 on the map) aren’t even on United’s radar.

Interestingly, North American’s #10 outbounder is Washington, which ranks #6 on United’s inbound list.

In accounting for these discrepancies, it is worth noting what North American says of their report’s methodology:

We define the top inbound and outbound states as those that have the highest proportion of moves where the absolute value difference of inbound and outbound moves is greater than or equal to 400. This weeds out states that had a small number of moves but would have a high ratio of inbound/outbound moves.”

This may explain why United’s 2017 champ Vermont and #5 South Dakota (United’s #1 in 2016 by the way) aren’t anywhere on North American’s Top Ten.

Atlas Van Lines

atlasvanlines.com

Washington Takes Atlas 2017 Inbound Crown

Atlas Van Lines offers some relative surprises too. Idaho, Washington and Nevada as their top three inbounders may not raise any eyebrows. But Alaska, Maine and New Hampshire at #5, #6 and #10? Oregon is a familiar name, but seeing them at #8 seems in contrast to their recent United Van Lines inbound championships.

Atlas’s top outbounder, meanwhile, is Illinois (same as both United and North American – those Fighting Illini have a real stranglehold on that top spot!). And their #2, West Virginia, was a strong outbounder for United for six years straight before balancing out in 2017.

But Nebraska at #3? Nebraska has been balanced for United since 2001! And #4 outbounder South Dakota has been an inbound darling for United the past three years.

Rounding out the Atlas top outbound list are Hawaii, Indiana, Delaware and Louisiana, all of them somewhat surprising since three of them have spent the last ten years on United’s “balanced” register. Only Indiana has managed to make a blip on United’s outbound radar in that time frame.

Inbound:

  1. Idaho
  2. Washington
  3. Nevada
  4. Tennessee
  5. Alaska
  6. Maine
  7. North Carolina
  8. Oregon
  9. Alabama
  10. New Hampshire

Outbound:

  1. Illinois
  2. West Virginia
  3. Nebraska
  4. South Dakota
  5. Hawaii
  6. Indiana
  7. Delaware
  8. New York
  9. Louisiana
  10. Kansas

In contrast to the percentages United and North American provide, Atlas gives actual numbers of inbound and outbound moves for each state. Here we see that Vermont has seen just a fraction of the moves so many other states see, so it’s easy to imagine why they wouldn’t have made it onto North American’s list. (Meanwhile, once again, Canada’s Yukon Territory has seen zero moves. We’ll blame it on the roads.)

Allied Van Lines

allied.com

Florida Takes Allied 2017 Inbound Crown

Allied Van Lines keeps it all very short and sweet. They report only their top fives:

Inbound:

  1. Florida
  2. Arizona
  3. North Carolina
  4. South Carolina
  5. Texas

Outbound:

  1. California
  2. Illinois
  3. Pennsylvania
  4. New Jersey
  5. Michigan

Based on this limited report, we’re able to come to at least one solid conclusion: Allied’s drivers love moving people south even more than North American’s do.

U-Haul

Texas Takes U-Haul 2017 Inbound Crown

Because news outlets predominately focus on Full Service van lines, it can easily be argued this eliminates an entire sector of the migrating public. (In fact, Full Service van lines actually conduct less than half of all moves performed in the US every year.)

Do U-Haul’s numbers reflect what the van lines suggest are moving trends?

Nope.

Inbound:

  1. Texas
  2. Florida
  3. Arkansas
  4. South Carolina
  5. Tennessee
  6. Washington
  7. North Carolina
  8. Connecticut
  9. Colorado
  10. Vermont

Outbound:

  1. California
  2. Illinois
  3. Pennsylvania
  4. Michigan
  5. Massachusetts
  6. New Jersey
  7. New York
  8. Arizona
  9. Maryland
  10. Georgia

Texas tops U-Haul’s 2017 Growth States list. This shouldn’t come as a huge surprise, as Texas has fared well recently in the inbound-outbound game. In 2017 their inbound percentages with United, North American and Atlas were 54, 53 and 53, while Allied put Texas down as their fifth biggest inbound state.

Oddly, Texas won U-Haul’s Growth State crown by bringing in – get this – a whopping 50.3% of all one-way truck rental traffic crossing Texas’s borders. That’s right. Fifty. Point. Three.

This hardly lends a whole lot more understanding to the migration trends we’re trying to dissect. But here we are, so let’s keep moving.

U-Haul rounds out its top five Growth States with Florida, Arkansas, South Carolina and Tennessee. Yes, Arkansas – which has been balanced on United’s report 37 of the last 40 years. Then again, Arkansas remained balanced in 2017 on United’s ledger with a 54% outbound rate, so that they are U-Haul’s #3 Growth State is rather surprising no matter how minuscule their positive U-Haul balance might have been.

And who comes in at #8 on U-Haul’s list? That big loser with United and North American (but not with Atlas), Connecticut.

On the flip side, U-Haul has Colorado at #9 – exactly where United and North American have them.

United States Census Bureau

Idaho Takes United States Census Bureau 2017 Inbound Crown

Yes, the Bureau has all the moving numbers we could possibly want. So many, in fact, that it could take until next January to weed through them all.

But thanks to Business Insider we don’t have to.

In this piece with the strangely long title: While the Bureau considers “a variety of components” in determining what’s happening among the more than 325 million people who make up the US population, Business Insider brings us what we need: domestic migration.

Here we see the net population gain or loss for each state for 2017. Births, deaths and international immigration are not counted; this is simply and strictly an account of how many people moved into or out of each state. (Again, not moves, but individual people.)

Inbound:

  1. Idaho
  2. Nevada
  3. South Carolina
  4. Oregon
  5. Arizona
  6. Washington
  7. Montana
  8. Florida
  9. Colorado
  10. North Carolina

And in this, the winner is Idaho, with a net domestic migration gain of 14.6 people per 1,000 residents. In second place comes Nevada, with South Carolina, Oregon and Arizona rounding out the top five. The second half of the big ten winners are Washington, Montana, Florida, Colorado and North Carolina.

These results actually mirror the van lines’ findings to a striking degree. Only Arizona, Montana and Florida don’t show up in United’s top ten. Seven of the Census top ten are also on North American’s top ten. Unbelievably, Colorado is #9 on all three lists.

As for the Net Domestic Migration losers? Yes, Illinois is up there, but at #5, maybe this is the survey they should be talking about in Chicago.

Outbound:

  1. Wyoming
  2. Alaska
  3. New York
  4. Hawaii
  5. Illinois
  6. North Dakota
  7. New Jersey
  8. Connecticut
  9. Louisiana
  10. West Virginia

The big loser in the 2017 migration tournament is Wyoming, a surprise since the Equality State doesn’t show up on any van line outbound lists – or inbound for that matter. United had them at 53% inbound for 2017. North American had them at 54% in. Only Atlas has them as outbound – based on a grand total of 330 moves.

The Bureau’s next three biggest net migration losers are Alaska, New York and Hawaii. Alaska and Hawaii, neither of which show up anywhere for United or North American, are Atlas’s #5 inbound and #5 outbound, respectively. North Dakota, New Jersey, Connecticut, Louisiana and West Virginia complete the Bureau’s top ten.

Again, while there are outbound wild cards, we still see some consistency between the Bureau and the van lines. Atlas and the Bureau actually have seven migration losers in common between their top tens. Looking at the US Census Bureau’s Net Domestic Migration map we can clearly see the winners clustered in the south and west with the losers dominating the northeast and midwest.

What’s The Takeaway?

Remember, the numbers put together by each of the van lines represent the migration trends among the customers they’ve served. Van lines count moves, the Bureau counts people.

This may not account for the reason United’s inbound champion Vermont is somehow a net loser according to the Census Bureau’s numbers, but it does suggest that, despite the discrepancies, the van lines and the Census Bureau can give a decent overall on what is going on out there.

But in the cases where data remains too contradictory to be meaningful, evaluating regions rather than individual states might give us a slightly more reliable picture of the migration trends playing out across the US. At the end of the day, we are only looking at a mere slice of the American migratory pie.

There’s More Realistic Data Out There

We need another, more encompassing way to look at where America is moving to and from.

DIY Moves and Hybrid Moves (besides U-Haul), which by far and away are the more common ways to move, are sorely misrepresented. When you move, do you routinely call up $2,000+ movers? Have you ever saved money by having your friends move you? What are these Full Service reports actually reflecting?

That’s something to keep in mind when the local news sounds off on “moving trends” based off a single Full Service Moving company’s report. 

×

I'm Moving

Moving? Thinking about moving? Whether your move is off in the distance or you already have one foot out the door, you'll learn about everything you should expect through our useful how-to's, cool articles and much more. It's all specially curated for you in our "I'm Moving" section.
Explore
×

I'm a Mover

For rookies or veterans alike, our "I'm a Mover" section is filled with extensive industry news, crucial protips and in-depth guides written by industry professionals. Sharing our decade of moving knowledge is just one way we help keep our professional movers at the top of their game.
Explore