2024 Study: Who’s Moving to Florida and Why?

Author:

Publish Date:

Last Modified Date:

Category: Moving Advice

Tags: Tags: , , , , , , , , , , , , , , , , , ,

Key Findings

  • According to HireAHelper data, 11.4% more people moved to Florida than left in 2023. 
  • In 2023, Wesley Chapel, FL (+106%) and Ocala, FL (+104%) had the highest net gain of new residents
  • The Miami, FL metro area had the highest net losses (-58%) in terms of moving
  • Ten times more people left Florida in 2023 for “change of climate” (≈43,000 people) than moved there for the same reason (≈3,700)
  • Retirement accounted for 8% of those moving to Florida in 2023
  • New Florida residents (average age 43) are, on average, 10 years older than Americans leaving Florida (average age 33)

In an episode of Seinfeld titled The Pony Remark, the eponymous character says, “My parents didn’t want to move to Florida, but they turned sixty and that’s the law.” Airing in 1991, the quote from this episode reflected a broader truth that many Americans were moving to Florida in droves during that time — especially New Yorkers

While Florida does have a history of being a retirement magnet that goes back to the 1910s, looking at migration to The Sunshine State through the lens of retirement moves would be reductive. As many as 4.3 million people moved to Florida from other U.S. states in the 1990s. Based on Census Bureau figures, for nine of 10 years of that decade, Florida was the #1 state Americans moved to.


“‘New job or transfer’…was by far the most common reason for moves bound for the Sunshine State, accounting for over half (~54%) of all moves to Florida in 2023.”


In this study, we delve into the migration trends shaping Florida today. Using a mixture of the U.S. Census and HireAHelper data, we explore moves to, from, and within Florida, and see which cities attract the most residents. We also outline the typical demographics of Florida movers, highlight the top reasons for people moving to or from Florida, and show how both have changed over time.


Southbound and Down: Three Decades of Migration to Florida 

In the last 10 years alone, Florida welcomed 3.4 million Americans as new residents. That’s roughly the population of the whole state of Utah! Of those, more than a third (1.2 million) moved to the Sunshine State since 2020, according to the Census Bureau’s statistics.

And it shows. As per the latest population statistics available, two-thirds (66%) of Floridians were born elsewhere in the United States, which is second only to Nevada (74%).

For a state that’s as large as Florida, it’s rather common to see this high volume of moves. What’s more remarkable is Florida’s net migration numbers remain positive. Meaning, that more people continue to move to the Sunshine State than leave it. 

According to HireAHelper estimates, approximately 11% more Americans moved to Florida than left in 2023, with an average of 13% net gain in residents in the last six years (which is as far back as our records go).


Along U.S. 1: Top Origins States to Florida are on the East Coast

And which states supplied all these new Florida residents? Migration to Florida used to be heavily dominated by New York, which was, according to the Census Bureau data, the #1 origin for moves going to Florida between 1990 and 2010.

In the last decade, Connecticut, Massachusetts, and Ohio have featured prominently on the list of states sending most people to the Sunshine State. Most recently, though, the top spot belonged to Georgia. In 2023, around 87,000 people moved from Georgia to Florida, which represented a quarter of all interstate moves destined for the Sunshine State in 2023.

State % of moves to Florida
Georgia 23.3%
New York 20.5%
Maryland 15.8%
Ohio 10.0%
Texas 9.4%
New Jersey 6.5%
Virginia 3.1%
North Carolina 2.7%
Arkansas 2.3%
Arizona 1.7%

Other states that contributed the most new residents to the Florida population in 2023 include New York (~21%), Maryland (~16%), and Ohio (10%). 

To see how many people moved to Florida from your state, check out our interactive map below. You can also use the drop-down to go back in time and see how that’s changed over the years.


Jobs, Retirement, and Housing: Top Reasons for Moving to Florida

Many may associate moves to Florida with retirement, but the overwhelming majority of people heading to this state are doing it for job-related reasons. 

“New job or transfer”, as the U.S. Census Bureau calls it, was by far the most common reason for moves bound for the Sunshine State, accounting for over half (~54%) of all moves to Florida in 2023.

Buying a home was the second most common reason for Americans relocating to Florida, with around 12% of all newly arrived Florida residents in 2023 making a move.

And then, there’s retirement – a reason responsible for 8% of all moves Americans made to Florida last year

Buying a home in Florida and moving there is a fairly recent trend. A historic high of 20% of moves to Florida in 2022 were made for this reason, but it was never this common further in the past.

Conversely, “change of climate” declined as a reason for moving to Florida in recent times. Remember that to the Census Bureau, “change of climate” can mean either escaping the consequence of climate change (like flooding or hurricanes) or wanting more sunshine. 

Accounting for roughly 10% of moves in any given year before 2020, less than 6% of people moving to Florida in the last three years did it because of the weather.


Move Over, Miami: Most Florida-Bound Moves Are Destined for the Gulf Coast

So with all those people moving to Florida, where are they choosing to live? In 2023, nearly half (48%) of all newcomers to Florida went to one of the following metro areas: Sarasota, FL (~24%), Tampa, FL (~13%) and Miami, FL (~12%).

Those familiar with Florida’s geography should notice that Sarasota, FL and Tampa, FL are on the Gulf Coast, as are five more metros that made the top 10 moved-to cities in the state.

Not only were Gulf Coast destinations most popular in 2023, but they also showed significant growth in the number of moves they attracted. 

Sarasota, FL had 45% more moves in 2023 than the year before, while Tampa, FL registered a 53% annual growth in inbound moves over the same period. Pensacola, FL had 13% more out-of-staters move in 2023, while Naples, FL received twice as many new residents from outside Florida, compared to 2022.

Curiously, even though the Miami metro area did make the top 3 destinations for out-of-state moves to Florida, its appeal appears to be declining. The city’s 9% year-over-year decrease in the number of new residents from other states in 2023 followed a more precipitous drop of 33% in the year prior.

See prices for local moving labor. Read real customer reviews. Easily book your help online.

Cheaper, Safer, Quieter: More Floridians Move to Smaller, Inland Cities

Despite a significant number of people moving to Florida from other parts of the U.S., the overwhelming majority of moves these days are local. The latest Census Bureau statistics showed that 54% of those moving stayed within the same county, while our data showed that the average distance of a move in 2023 was 32 miles.

Based on data from HireAHelper moves in Florida, the two cities that saw the greatest net inflow of new residents in 2023 are Wesley Chapel, FL (+106%) and Ocala, FL (+104%).


“In 2023, the average household income of those moving to the Sunshine State was $104,000. Not only is it significantly higher than the national average of $74,580, but it is also 44% higher than the income of those leaving Florida…”


Other cities that had more people move in than leave include St. Augustine, FL (58%), The Villages, FL (+50%), Pensacola, FL (+49%), and Port St. Lucie, FL (+48%).

One trend likely impacting moves within Florida is extreme weather, as some Floridians flock inland to places like Ocala and The Villages to escape the hurricanes and the associated high home insurance costs in coastal areas. Nowhere in Florida is completely safe from a hurricane, but it seems moving away from certain coastal areas may be relatively safer.

Another consideration for moving decisions is traffic congestion and the high cost of living in Florida’s larger metros. These issues may be behind people’s moves to more suburban areas, such as Bradenton, FL or Port St. Lucie, FL. 

10 Cities with Largest Net Gains Net Moves, % 10 Cities with Largest Net Losses Net Moves, %
Wesley Chapel, FL 106% Hollywood, FL -58%
Ocala, FL 104% Fort Lauderdale, FL -50%
St. Augustine, FL 58% Palm Harbor, FL -42%
The Villages, FL 50% Miami, FL -38%
Pensacola, FL 49% Cape Coral, FL -37%
Port St. Lucie, FL 48% West Palm Beach, FL -35%
Gainesville, FL 44% Tampa, FL -34%
Clermont, FL 43% Fort Myers, FL -31%
Port Orange, FL 27% Orlando, FL -31%
Daytona Beach, FL 23% Pompano Beach, FL -28%

In contrast, cities that had lost the most residents are Hollywood, FL (where 58% more people left than moved in), Fort Lauderdale, FL (-50%), and Palm Harbor, FL (-42%). Miami, FL wasn’t too far off with 38% more outbound than inbound moves in 2023.

Local reports suggest that the high cost of housing could be what’s driving moves out of cities in Miami-Dade County. Home prices reached up to 50% higher and rents were 30% higher in this area, compared to other places in Florida.

Our interactive map shows how other cities have fared in terms of people moving in and out in 2023, based on HireAHelper data.


Ocala for Cheaper Housing, Melbourne for Retirement: Moves to Florida Cities by Reason

If we look at why people are moving to different cities in Florida, a few interesting patterns begin to emerge.

According to our analysis of the Census Bureau data, 57% of people who moved to Ocala, FL did so because they bought a home there. New jobs were the main driver of moves to Naples, FL (58%) and Bradenton, FL (38%), while those moving to Port Saint Lucie, FL did so predominantly because they wanted a better home (41%) or a better neighborhood (36%).

Two cities on Florida’s Atlantic coast, Palm Bay, FL and Melbourne, FL, had around 40% of people moving there for retirement. 

Finally, cheaper housing greatly contributed to those moving to Lakeland, FL (32%) and Naples, FL (30%). 

But with some of the highest home prices in the state, Naples, FL being a destination “for cheaper housing” is surprising. Its status as a top 10 contender for those moving into Florida from other states might explain this discrepancy.


Older, Higher in Income, Mostly White: Demographics of Americans Moving to Florida

According to the figures from the Census Bureau, Americans moving to Florida were, on average, 43 years old and over half of them (53%) were women. Generationally, 56% of them are either Gen X (30%) or Baby Boomers (26%).

While 43% of newcomers to Florida were married, almost one in five (19%) were divorcees, which was the 4th highest proportion among all states.

From a racial standpoint, 75% of those moving to Florida were white, which was significantly higher than the 60% of white Americans among interstate movers nationally.

40% of Americans opting to move to Florida have a college degree (undergraduate or postgraduate), which was only slightly lower than the average of 43% of interstate movers nationally in 2023.

Looking at the demographics of people moving in and out of Florida, income is one characteristic that stands out. In 2023, the average household income of those moving to the Sunshine State was $104,000. Not only is it significantly higher than the national average of $74,580, but it is also 44% higher than the income of those leaving Florida ($72,427 on average).

This 44% difference between the incomes of those moving in and those moving out was the also highest it has been in over 30 years.

See prices for local moving labor. Read real customer reviews. Easily book your help online.

Younger, Mostly Single, Mostly People of Color: Demographics of Those Leaving Florida

With an average age of 33.5, two-thirds (67%) of Floridians who left the state in 2023 are either Millennials (36%) or Gen Z (31%)

Unlike those moving in, the majority (54%) of people who left Florida last year are people of color, with roughly equal shares of black (24%) and Hispanic Americans (24%).

When it comes to their marital status, 53% of former Florida residents choosing to move elsewhere are single. It must be noted that the Census Bureau’s definition of “single” includes cohabiting couples that aren’t married in the legal sense of the word.

As noted above, those leaving Florida earn significantly less than those moving in. 


Jobs, Family, and Climate: Top Reasons for Leaving Florida

Speaking of leaving Florida, over 285,000 Americans left the Sunshine State in 2023. The most common reason for such a move was a new job (37%).

The second most stated reason for leaving Florida is the “other family” reason (16%), which the Census Bureau defines as moving in with or closer to family members.

The third most popular one — “change of climate” — was responsible for 15% of all moves out of Florida last year.

As stated earlier, the reason encompasses both those who move in search of better weather and those who move to escape climate change. What’s remarkable about this statistic is that in 2023, ten times as many people left Florida for climate-related reasons (≈43,000) than moved in (≈3,700).

Since the Census Bureau has started tracking reasons for moving in their Current Population Survey, the number of Americans leaving Florida for climate-related reasons has never outnumbered those moving into the state — until 2021. 

Due to the ambiguous definition of this reason for moving, it’s impossible to say with 100% certainty that all those who left Florida for climate reasons were escaping climate change. 

However, hurricanes in the state have been getting stronger and more devastating, and the temperatures are growing increasingly higher, especially in the southern parts of the state.


Cost, Size, Distance: Industry Stats on Florida Moving

For all the moving in, out, and within Florida, it remained one of the cheapest states in terms of moving costs.

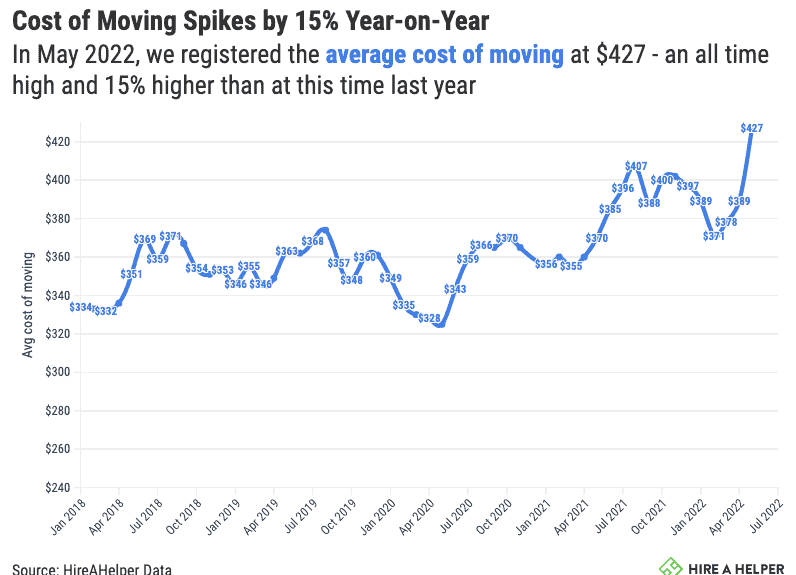
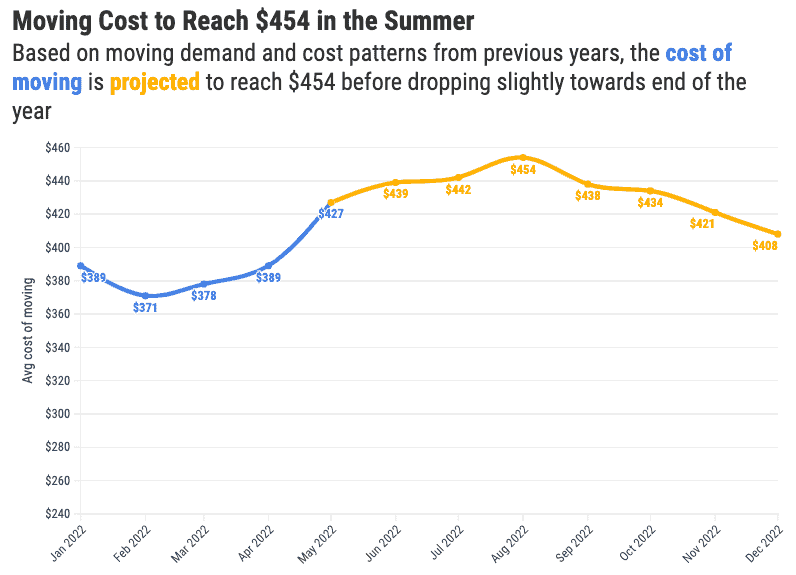
The average price of a move was $390 in 2023, making Florida the 9th cheapest state for moving. Moving prices held surprisingly steady and only grew 4% in the last year, up from $375 in 2022.


“Migration to Florida used to be heavily dominated by New York, which was, according to the Census Bureau data, the #1 origin for moves going to Florida between 1990 and 2010.”


Much like in the rest of the US, the distances of moves in Florida decreased. With spikes up to 70 miles on average in the pandemic years, the average move distance in Florida in 2023 was 31.5 miles.

The average size of homes people are moving into and out of in Florida is 1,546 square feet. That is just under the typical size of a home in the Sunshine State, which is 1,694 square feet.


Sources and Methodology

HireAHelper’s Florida Migration Study used the following data sources: 
Net gains and losses in people moving in/out for both states and cities were calculated as the ratio of:
  • # of people moving into the state or city, to
  • the # of people moving out of the state or city,
  • expressed as a percentage (%)
Comparisons of net gains and losses only include cities with at least 50 in- or out-moves.

2023 Study: Where Americans Are Moving Abroad Post-Pandemic

Author:

Publish Date:

Last Modified Date:

Category: Moving Advice

Tags: Tags: , , , , , , , , , , , , , , , , , , , , , , , , , , ,

Key Findings:

  • The UK is the #1 destination for moving abroad (~21,900 moves), ahead of Mexico (19,620 moves).
  • Compared to the same period last year, 30% more Americans moved to the UK in the first six months of 2023 
  • Canada welcomed 10% more Americans as new residents in the first six months of 2023 than at this time last year, according to official figures
  • 22% more Americans moved to European countries in 2022 (100,320) than in 2021
  • Fewer Americans are interested in moving abroad in 2023, as the number of relevant Google searches is down 30% year-over-year

When we last covered the topic of Americans moving abroad in late 2022, the interest in leaving the country was the highest it’s been since the Presidential Elections in 2016.

This year, despite a 30% reduction in moving-abroad-related Google searches, American moves outside of the country don’t seem to be slowing down. In fact, more Americans moved to the UK, Mexico, and Canada so far in 2023 than at this time last year. 

In this year’s study, we chart the updated numbers of Americans moving abroad, look at top destinations overall, and highlight the fastest-growing areas in recent years.


Less Googling, More Moving: Moves to Top Destinations Hold Steady as Search Interest Declines

In the first nine months of 2023, there were around 59,000 monthly Google searches in the United States for “moving abroad” or “moving to <insert country>”.


“Not only has the UK overtaken Mexico as the top destination overall, but Canada received fewer U.S. citizens as new residents (10,415) than France (12,220), Spain (11,156), and Germany (10,510).”


Impressive as that number is, it’s 30% less than in 2022 when the average number of monthly searches for moving abroad and related keywords was 84,020. This includes a 53% reduction in searches for “moving to Canada”, and an 81% year-over-year drop in searches for “moving to Spain”.

Only a handful of countries saw a higher search interest in 2023. Searches for moving to the Middle Eastern countries of Bahrain (+50%) and Saudi Arabia (+43%) spiked the highest, while Belgium (+18%) and South Africa (+15%) saw a moderate increase in relocation interest.

an illustration of two people sitting in a living room. the canadian flag can be seen waving outside the window.But while the search interest in moving abroad is waning, the number of U.S. citizens moving to some of the top destination countries in 2023 is increasing year-over-year.

The United Kingdom, for example, had over 11,500 Americans move there from January through June 2023, about 30% more than in the first six months of 2022. The number of Americans who moved to Canada (+10%) and Mexico (+1%) in the first eight months of 2023 is higher than in the same period last year. 


Steady Flow: American Moves Abroad Hit Five-Year High in 2022

According to official statistics, almost 160,000 U.S. citizens relocated to one of 40 different countries for work, study, or family reasons in 2022. Which is more Americans leaving the country than any year since 2017

The most popular destinations for Americans moving abroad include countries such as Mexico, Canada, the UK, all the countries of the European Union, Japan, South Korea, Australia, New Zealand, Brazil, Costa Rica, and Israel.

2022’s figure is not only the highest number going back five years, but it also represents a 16% increase in the number of moves abroad compared to 2021. In fairness, the years 2020 and 2021 were significantly affected by the pandemic, resulting in a significant decrease in moves abroad and travel in general.

Taken together, over 821,000 U.S. citizens relocated to one of these 40 countries since 2017. 

See prices for local moving labor. Read real customer reviews. Easily book your help online.

Move Over, Canada: Top Destinations for American Moves Abroad in 2022

If Americans are leaving the country in record numbers, where are they going? Traditionally, the top destinations have been America’s neighbors Canada and Mexico, and the United Kingdom, with whom the U.S. has significant historical ties.

In 2022, however, the top destinations looked different. Not only has the UK overtaken Mexico as the top destination overall, but Canada received fewer U.S. citizens as new residents (10,415) than France (12,220), Spain (11,156), and Germany (10,510).

As Canada drops a few places in the destinations ranking, Japan is on its way up. Having been closed for entry due to the COVID-19 pandemic longer than most countries, it only properly reopened in 2022 to see 6,642 U.S. citizens relocate there — more than twice as many moves than in 2021 (2,983).

Surf’s Up: Fastest-Growing Destinations for Americans Leaving the U.S.

Japan may have recorded a significant bump in the number of U.S. citizens relocating there, but it’s actually a return to normal numbers after the steep drop caused by COVID. 

Portugal has seen the greatest influx of moves (+195%) from the United States compared to before the pandemic. Known for being one of the sunniest countries in the world, with a relatively low cost of living, and beautiful beaches, it became a top destination for digital nomads during the pandemic years. 

New Zealand — another country with world-renowned beaches and scenery — is the second fastest-growing destination for Americans moving abroad, with 146% taking residence there in 2022, compared to 2019.

On the other hand, countries such as Brazil (-50%), Ireland (-33%), and South Korea (-31%) saw the number of Americans moving decline compared to pre-pandemic levels.

Why We Leave: Some Reasons Behind Americans Moving Abroad

While we don’t have hard data on the specific reasons why Americans decide to leave the United States, there are a few factors we can pinpoint.


“According to official statistics, almost 160,000 U.S. citizens relocated to one of 40 different countries for work, study, or family reasons in 2022. Which is more Americans leaving the country than any year since 2017.”


According to a recent Washington Post analysis, one reason for the rise of Americans moving to Mexico is that ethnic Mexicans (who were born in the U.S. and have U.S. citizenship) decide to move to Mexico with family. Deportations, unfortunately, also play a part.

The same analysis picks out “a sense of adventure” as one of the forces driving Americans to move abroad, such as wanting to work or study somewhere completely different. More pragmatic reasons include lower cost of living, lower taxation, and better quality of life, as CNN’s reporting suggests.

There is some anecdotal evidence that the rise of remote work and the digital nomad movement is responsible for some Americans leaving the U.S., but it’s difficult to estimate how permanent those moves are and how many people are making them.


Sources and Methodology

Only moves with stated reasons indicating a certain degree of permanence were analyzed, including work, study, and family. Military moves were excluded, as were the moves for temporary purposes, such as temporary business and tourism.
Sources for each country:
The number of monthly searches was taken from Google Ads API as the total average monthly search volume for keywords of the type “moving to <insert country>” (e.g., “moving to Canada”, “moving to Mexico” and “moving abroad”.

Illustrations by Emma Donnelly

Study: How Much Does Moving Cost in 2023?

Author:

Publish Date:

Last Modified Date:

Category: Moving Advice

Tags: Tags: , , , , , , , , , , , , , , , , , , , , , ,

Key Findings

  • Based on our projections, the cost of moving in 2023 will be 2% lower than in 2022
  • Moving costs are 4% higher so far in 2023 than in the same period last year
  • The average cost of a move is projected to peak at $421 by August 2023, 7% lower than last year’s high of $454
  • Moving costs are spiking highest in New Mexico (+39%), Kentucky (+30%), and Minnesota (+25%) in the first five months of the year
  • Maine (-15%), Rhode Island (-14%), and Oklahoma (-10%) are the states with the lowest cost of moving compared to this time last year
  • Cypress, TX (+39%) and Louisville, KY (+39%) are the cities where the cost of moving is spiking in 2023, compared to last year


When we looked into the cost of moving last year, prices were buoyed by record-high inflation, as well as the rising costs of fuel, cars and trucks; unsurprisingly, moving costs soared to an all-time high. 

Overall, with a peak of $454 in August, the average cost of moving in 2022 was $410 — 7% higher than the year before.

Has it gotten better? Well, based on our figures for the first five months of 2023, the average cost of a move in the United States at the half way point is currently $399, some 4% higher than in the same period last year!

But will the cost of moving in 2023 remain as high all year long, or will costs fall back to Earth? Which states are seeing the most dramatic jumps in moving costs compared to last year? And are there any places where moving is actually getting cheaper?


Still Up on Last Year: How the Cost of Moving Changed Over Time

Based on the moves booked via HireAHelper and our partners in the first five months of the year, moving costs an average of $399, just 2% higher than the $391 we recorded at the same time in 2022.

“…with the projected annual average of $402, the average cost of a move would still be significantly higher than it was before last year, especially before the pandemic.”


That being said, last year we saw the cost soar from $389 in April to $427 in May, a jump which didn’t happen this year; average costs largely lingered around the $400 mark.

While this is good news relative to last year, it’s worth remembering that before and during the pandemic, moving used to cost significantly less, and only started to edge into the $400 or greater territory around late 2021.


More Affordable in Maine, Costlier in Kentucky: Cost of Moving Change by State

As the cost of moving continues to climb upwards at the start of the year, here are the states where movers are most likely to be feeling the pinch.

an illustration of a microscope looking at a miniature home, moving boxes, and a price tagBased on HireAHelper figures for the first five months of 2023, New Mexico (+39%) and Kentucky (+30%), are the states where not only moving costs over 30% more than last year, but also where the average price of moving now exceeds $500.

Similar spikes in the cost of moving are seen in the three Midwestern states, the highest being Minnesota, where the cost of moving went is 25% higher so far this year. 

In Missouri and Wisconsin, the year-over-year increase in moving costs is 17% so far in 2023. Incidentally, Wisconsin is the state with the highest average price of a move this year – $515.

Other states where moving costs are significantly higher this year are Illinois, Massachusetts, and North Carolina. In these states, according to our data, people are paying around 9% more for their move in 2023 than they would at this time last year.

But it’s not all bad news! While the majority of states are seeing the cost of moving go up, there are 13 where it’s gotten cheaper than it was last year.

Maine, the state where the cost of moving spiked 51% last year, currently has the biggest annual decrease in the average move price of -15%. The state with the second-biggest dip in the cost of moving is Oklahoma, where it’s 10% cheaper to move so far this year than it was in 2022.


“…the biggest year-over-year drop in the average cost of a move in Oklahoma City, OK, where the cost of moving is 24% lower so far in 2023.”


Idaho (-9%), Connecticut (-6%), and Utah (-5%) are other states with fairly sizeable reductions in the average cost of a move. States that registered smaller decreases include Tennessee (-4%), Virginia (-2%), and California (-2%)

One possible explanation for prices dropping in these states is cheaper fuel. Based on LendingTree’s recent analysis of fuel price changes, states such as Maine, Rhode Island, Oklahoma, Tennessee, and Virginia saw some of the biggest drops in gas prices so far in 2023.

See prices for local moving labor. Read real customer reviews. Easily book your help online.


Up in Louisville, Down in Oklahoma City: Cost of Moving by City

While our data suggests that nationally the cost of moving is up only 4%, some cities are seeing spikes that far exceed that figure.

In as many as 10 cities, the average amount people pay for their move in 2023 is at least 25% higher than it was at the same time last year. This cost of moving spike is most significant in Louisville, KY (+39%) and Cypress, TX (+39%).

In fact, Louisville, KY is the city where the average cost of a move is the highest overall so far in 2023 and is at $531.

Further down the list, Greensboro, NCIrvine, CA, and Saint Louis, MO registered an annual increase in moving costs of about 33%. 

At the city level, the place with by far the biggest year-over-year drop in the average cost of a move was in Oklahoma City, OK, where the cost of moving has been 24% lower so far in 2023.

Fairfax, VA, Chandler, AZ, and San Diego follow closely, featuring an overall 19% reduction in how much people paid for their moves in the first five months of this year.

Two Texan cities where moving is already among the cheapest in the country, Spring, TX and Katy, TX, registered, respectively, 17% and 15% year-over-year decreases in the cost of moving in 2023.

Check our interactive map showing the change in the cost of moving across states and cities in 2023:


Silver Linings: Moving Should Get (Slightly) Cheaper in 2023

Based on our figures, the cost of moving is projected to drop this year. So far in 2023, the average cost of a standard labor-only move is $399, which is a little higher than in the first five months of last year ($391). 


“…last year we saw the cost soar from $389 in April to $427 in May, which didn’t happen this year, as the costs largely lingered around the $400 mark.”


However, because we have not seen the cost of moving spike from April to May as we did last year, we can project that it’s unlikely to be as high as it was in 2022. This prediction isn’t just based on our data alone.

So far, this year is the first year since 2017 when new and used vehicles are seeing an annual price decrease. Inflation in fuel prices, as well as inflation in the U.S. economy overall is on a downward trajectory, all contributing to the small drop in projected moving prices.

Based on this year’s projections, the price will, again, peak in August when it’s likely to reach an average of $421. But that would be a far cry from last year’s $454 at the height of the moving season.

Similarly, if last year’s cost of moving didn’t dip below $400, this year we project that it will fall to $395 by the end of the year.

All this said, with the projected annual average of $402, the average cost of a move would still be significantly higher than it was before last year, especially before the pandemic.

This is all the more reason to make sure not to overspend on your move. Check out our most recent tips on how to cut moving costs or how to save money if you’re planning on renting a truck for your move. For those of you moving this summer, have a look at our guide to saving money when moving during the peak moving season.


Sources and Methodology
All charts and tables are based on the analysis of 263,000 local moves in the U.S. booked through HireAHelper.com and our partners from January 2018 through May 2023.
States and cities with less than 100 moves in the last 12 months were excluded from the state-by-state and city-by-city analysis, respectively. However, calculations of the cost of moving by month of the year or day of the week do include data from all states and cities.
Illustrations by Shideh Ghandeharizadeh

2023 Study: Corporate Relocation at Highest Rate Since 2017

Author:

Publish Date:

Last Modified Date:

Category: Office Moves

Tags: Tags: , , , , , , , , , , , , , , , , , , , , , , , , , , , , , , , , , , , , , ,

Key Findings

  • 593 (~9%) of America’s corporations moved headquarters since the beginning of 2022, the highest rate since 2017
  • 29% more companies moved their HQs in 2022-23 than in the previous fiscal year
  • 20% of corporate relocations happened within the same city; 31% moved to a different city within the same state
  • 62% of corporations moved to a city with a smaller population
  • According to our survey, 72% of people would be prepared to move with their employer, provided relocation costs were covered
  • Almost half (44%) of our survey respondents would be willing to follow their employer to a different state

Whether to cut costs, gain a more beneficial tax rate, or be closer to a target market, about 9% of corporations in the United States moved their headquarters within the past fiscal year — the highest percentage since 2016-17, according to Securities and Exchange Commission (SEC) filings.

States like New York and cities like Seattle are seeing corporate headquarters move away, while smaller cities outside large urban centers are becoming new homes to big companies in tech and pharmaceuticals.

Our study breaks down where companies are moving to, which states and cities they’re leaving behind, and whether workers are on board with following their employer to their new HQ location.

On the Move: Corporate Relocation Rate Highest in Seven Years

According to the most recent SEC figures, 593 (or 8.9%) of the roughly 6,700 publicly traded corporations in America moved their HQs in the past fiscal year (i.e., March 2022-March 2023).

2022-2023 had the highest rate of corporate headquarters relocation in seven years, and it’s been on the rise since it took a dip to below 7% in 2020 (likely due to the pandemic).

Comparing the absolute number of companies moving their offices year-over-year, the 593 corporations moving HQs in 2022-23 represents a 29% growth over the fewer number of companies (458) that relocated in 2021-22.

It is also the highest year-over-year bounce in a decade, besting even the post-pandemic return to activity in 2021-22. That was a banner year, where the number of corporations relocating their HQs went up by 25%.

Moving far away?

Do it cheaper.


HireAHelper.com can save up to 40%, compared to traditional interstate moving companies. Click here to learn how.

Top States

Florida for the Win: Which states are corporations moving to?

Not only are corporates moving in high numbers, but as many as 24% of those that moved chose to relocate their headquarters to a different state entirely. Here’s the breakdown.

Florida had 86% more corporations move their HQ there, compared to the number of companies that chose to move their head office out of Florida — the highest net gain of any state!

Texas, the state that in the last year has officially moved their welcomed Hewlett-Packard and Caterpillar Inc, among other companies, saw the second highest net gain (71%).

Two other states had notably strong showings, Arizona (+65%) and Utah (+57%), both saw very impressive growth in the number of HQs of America’s corporations they now host.

Which states are corporations leaving?

Office moving trends appear to be relatively similar to individual people’s moving trends, at least in the sense that leaving places like New York and California is a popular idea.

The state that corporations were most likely to abandon was, surprisingly, Washington, with 83% more companies leaving it than moving in. Notable departures include media company Arena Group, and Clearsign Technologies, a developer of emission control solutions.

New York (-51%) and California (-46%) aren’t far behind Washington, ranking second and third among the states that lost the most corporate HQs, respectively.

Among the companies that left New York are Philip Morris International and the financial firm Assurant, Inc. California’s noteworthy departures include the coworking space giant WeWork and clinical nutrition company Guardion Health Sciences.


Location-based Insights

  • Florida (+86%) and Texas (+71%) are the states with the greatest net gain of corporate headquarters in the past year
  • Washington (-83%) registered the highest net loss of corporate HQs since the start of 2022
  • Waltham, MA (+175%), Burlington, MA (+133%), and Spring, TX (+100%) had the most corporate move-ins, compared to the number of those moving out
  • Cambridge, MA (-40%), Seattle, WA (-37%), and San Jose, CA (-25%) are the cities with the largest net losses of corporate HQs in the past year

Top Cities

Going East: Which cities are corporations moving to? 

When it comes to specific destinations for corporates looking for a new HQ, Waltham, MA saw the highest corporate net growth across cities over the past fiscal year (+175%). (Five companies moved to this relatively small city on the outskirts of Boston, and not a single one left.)

Noteworthy new corporate residents of Waltham, MA include biotech and pharmaceutical firms such as Cogent Biosciences and CinCor Pharma.

Burlington, MA (+133%) and Spring, TX (+100%) are second and third in growth, respectively. Burlington’s newly headquartered corporations are software companies and biotech firms, while Spring, TX is where Hewlett-Packard moved their headquarters in a widely publicized move

Meanwhile, three cities in Florida are among the 10 with the highest net gains: Jacksonville, FL (+67%), Tampa, FL (+49%), and Miami, FL (+33%).

Which cities are corporations leaving?

Unexpectedly, the city that lost the most corporate HQs compared to the number it gained is Cambridge, MA (-40%).

This famous college town next to Boston, MA has long been a mecca for many biotech and pharma firms, which seemingly doesn’t leave room for previous industry giants. 


“Not only are corporates moving in high numbers, but as many as 24% of those that moved chose to relocate their headquarters to a different state entirely.”


Just beneath Cambridge, Seattle (-37.5%), as well as multiple cities in the Bay Area of California, lost multiple company headquarters over the past fiscal year compared to the number they gained. New York City (-13.4% ) also makes an appearance in the 12th spot.

It is worth noting that despite the net losses, dozens of companies still established their new headquartered in New York City within the past year, as well as in other net loss cities, like San Jose and San Francisco.

See prices for movers by the hour – instantly.

Read real customer reviews.

Easily book your help online.


Top Potential Reasons for HQ Relocations: Lower Taxes, Lower Rent

Based on our most recent moving study, Americans mostly move for new or better housing, or for a new job. But what are the main reasons behind corporate relocations?

One commonly presumed reason is the desire to cut costs, which can mean moving to areas where taxes are lower. This might explain why Florida and Nevada are seeing more corporations move in versus out. 

Of note, the Tax Foundation’s 2023 State Business Tax Climate Index measures, among other things, how burdensome state taxes are on businesses. It lists Florida and Nevada among the 10 least tax-burdened states. Meanwhile, Texas — a state without a corporate tax — is not too far behind in 12th place.


“Assuming moving costs are covered, over 72% of respondents in a nationally representative survey HireAHelper conducted earlier this month said they’d be ready and willing to move with their employer.”


Another reason for corporate relocation is that the cost of office space is too high. Looking at office rent levels across the country, most cities that registered net losses of corporate HQs (e.g., New York City and San Jose) are among the most expensive for business rental costs.

The cost of office space is a problem that’s also been exacerbated by the rise of remote work in the pandemic years. America’s biggest cities continue to struggle with high office vacancy rates, as companies remain remote, or adopt a hybrid work arrangement.

In support of this trend, our analysis of 2022-23 SEC filings showed that 62% of corporates that relocated their HQ in the past year moved to cities with smaller populations, and in turn, more affordable rental rates.

Employee Perspectives: Most Americans Willing To Move with Employer 

corporate relocation hireahelperIt’s sensible for corporations to seek better fiscal conditions for their business. But what about the employees that get caught up in corporate relocations and transfers?

We may not know what percentage of employees are forced to relocate when a corporation moves its HQ, but we do have data that suggests a significant percentage of employees would be willing to move for work.

Assuming moving costs are covered, over 72% of respondents in a nationally representative survey HireAHelper conducted earlier this month said they’d be ready and willing to move with their employer. Surprisingly enough, ~27% would be willing to move to a “nearby” state, and almost one in five (~17%) said they would consider traveling with their employer across the country.

On the whole, willingness to relocate with the employer reportedly decreases with age; Gen Y/Millennials (~78%), are more likely to move with their employer than Gen Z (~74%). 

Curiously enough, it’s actually Gen X that seems most amenable to moving to a different state on the other side of the country (~21% of Gen X respondents, compared to ~19% of Millennials and ~15% of Gen Z members.).

Having children doesn’t appear to dramatically affect the desire to follow the employer’s move, either. Over 75% of Parents would be prepared to make a move for their company, provided relocation costs were covered, which is actually more than the 69% of Non-Parents who said they were willing to move with the company they worked for.

People of Color (~78%) are more likely to consider such a move than White Americans (69%), with ~31% of people of color saying they would be prepared to move to a state in a different part of the country, compared to ~25% of white Americans.


Sources and Methodology
All the data used in this study, unless otherwise stated, were taken or derived from the public database of Financial Statement Data Sets, available on the website of the U.S. Securities and Exchange Commission (SEC).
Headquarters location was taken as the “business address” field of each company’s filing and each change in the business address of the company was counted as a move of their headquarters.
The annual HQ moving rate in a given year was calculated as the number of companies that changed address compared to the total number of companies that had filed with the SEC in that year, expressed as a percentage.
As per the disclaimer issued by the SEC regarding this data: “The Financial Statement Data Sets contain information derived from structured data filed with the Commission by individual registrants as well as Commission-generated filing identifiers. Because the data sets are derived from information provided by individual registrants, we cannot guarantee the accuracy of the data sets. In addition, it is possible inaccuracies or other errors were introduced into the data sets during the process of extracting the data and compiling the data sets.
Only companies based in the United States were included in the analysis.
Illustrations by Sean O’Brien

2022 Study: Trends and Findings From Americans Moving to Mexico

Author:

Publish Date:

Last Modified Date:

Category: International Moving

Tags: Tags: , , , , , , , , , , , , , , , , , , , , , , , , ,

Key Findings

  • The number of U.S. citizens moving to Mexico in 2022 is set to reach 18,161 — the highest in nearly a decade 
  • More than half (52%) of Americans who moved to Mexico in 2022 were retirees
  • Jalisco and Mexico City attract nearly a third (31%) of all U.S. citizens moving to Mexico 
  • Rent is two times lower than in the United States, on average
  • There was an avg. of 1,870 monthly Google searches for “moving to Mexico” in 2022 — a 42% YoY increase
  • North Carolina (+75%), Texas (+65%), and Florida (+60%) saw the greatest YoY increases in Google searches for “moving to Mexico”

The number of Americans moving to Mexico over recent years is estimated to be between 800,000 and 1.5 million. And lately, that number has been growing rapidly.

Americans leave the country for any number of reasons: relaxed COVID restrictions, affordable housing, affordable healthcare and social care, greater conditions for remote work, warm climate, amazing food, rich and varied culture, and the list goes on. Mexico has all of these things, and it’s right next door.

But what is the cost to the country? The influx of immigrants with higher incomes is reportedly having adverse effects on the local population; there are reports of gentrification in Mexico City, rents doubling in Tijuana, and foreign demand driving up prices in Quintana Roo and Baja California Sur — all places that are among the top destinations for Americans settling into Mexico.

Let’s dive into the numbers and see just how many Americans have moved to Mexico in 2022.

Going South: Migration to Mexico To Reach New Heights in 2022

As reported in our recent study of Americans moving abroad, 10,594 U.S. citizens have taken residence in Mexico so far in 2022.

Not only is that 22% higher than by the same time last year, but at this rate, it’s estimated 18,161 Americans will have moved to Mexico by the end of 2022. That figure is higher than in any year since 2013.

When looking at this trend in more detail, the number of temporary residents (as opposed to permanent residents) has increased sharply. Temporary residents are defined as people who intend to stay in Mexico for longer than 180 days for the stated purposes of either work, study, reunification with family or business ventures.


“… it’s estimated 18,161 Americans will have moved to Mexico by the end of 2022. That figure is higher than in any year since 2013.”


Already in 2021, over 9,000 U.S. citizens have successfully applied for a temporary residency in Mexico; that’s the highest number of applications over the last decade!

By the end of this year, Mexico is on track to receive 10,780 Americans as new temporary residents.

Jalisco — Not Mexico City — Is the Top Destination for American Immigrants

There is certainly a lot of buzz about Americans moving to Mexico City, but it is the state of Jalisco that consistently sees more U.S. citizens moving in than Mexico’s capital… or any other state for that matter.

american migration

Over 2,000 Americans have moved to Jalisco in 2022, and that figure is likely to reach 3,400 people by year’s end. That would mean nearly one in five (19%) Americans moving to Mexico choose to move to Jalisco, a West Coast city.

The nation’s capital, Mexico City, isn’t too far behind Jalisco. Mexico City has seen 1,315 American move-ins so far in 2022, with 2,254 projected by year’s end (~12% of the total migration). Baja California Sur also ranks high, with an estimated 1,867 new residents from the United States, (~10% of the total inflow).

Another state that seems to be fast becoming a popular destination is Quintana Roo

Best known for being home to Cancun, this state is beginning to attract Americans looking to live (and not just party) there. In 2022, Quintana Roo is projected to attract nearly 13% of all moves from the United States — that’s second only to Jalisco.

Taken together, these four states receive the majority (54%) of all Americans moving to Mexico.

Moving far away?

Do it cheaper.


MovingPlace can save up to 40% compared to traditional interstate moving companies. Click here to learn how.

Remote Work? More Like Retirement! Most Common Reasons for American Immigration to Mexico

Since 2012, almost a third (31%) of all Americans who moved to Mexico as temporary or permanent residents reportedly did so for work. That’s based on the official immigration statistics which group all new residents into categories of “work”, “family reunification”, “retirement”, and “other”. 

An additional 23% of immigrants from the United States get their resident permits in Mexico by being a family member of either a Mexican national or another U.S. citizen who already has a valid residence permit.

The most popular category of permits issued to Americans is called “rentista” – which is the most common route to residency for retirees.

In the last decade, 40% of all U.S. citizens who took up residency in Mexico were retirees; this year, that share has jumped to 52%. In other words, over half of all Americans moving to Mexico are reportedly doing so during their retirement. This might suggest U.S. cost of living is having an impact on social security stability as well.

Tourists or Residents?

And what about that segment of American remote workers whose moves to Mexico have been subject to much discussion and debate

As the number of U.S. citizens moving to Mexico is setting new records, in some parts of Mexico, calls for Americans to go back home are beginning to be heard.

mexico american immigration

While Mexico does offer a Temporary Resident Visa for remote workers under the Financial Solvency clause, official statistics don’t distinguish these types of residents from other temporary resident holders. It is likely that they are bundled into the “Other” category, which also covers people relocating for scientific research, government work and more.

Iit’s reasonable to assume remote workers who are giving Mexico a go are likely making use of Mexico’s easy-to-obtain tourist visas, which allow immigrants to stay in the country for up to six months.

Summer Spike: Searches for Moving to Mexico Peaked in June 2022

The data show no sign of American immigration slowing down anytime soon. On top of the growing number of recorded moves, moving intent (signified by Google searches for “moving to Mexico”) is the highest it’s been in years.


“…there wasn’t a single state that didn’t increase their Googling of Mexico.”


From 2019 to 2021, the number of monthly Google searches for “moving to Mexico” tended to stay between 1,500 and 2,000. 

By the middle of 2022, however, these searches reached 3,100. Though it’s not simple to know the causation, that spike correlates with the U.S. Supreme Court’s overturn of the precedent-setting Roe v. Wade decision, as well as 9.1% currency inflation in America its highest rate in 40 years. 

Where in America ‘Moving to Mexico’ Searches Peaked

The average number of monthly Google searches in America for “moving to Mexico” rose roughly 36% year-over-year, reaching 2,100 searches in 2022 — that’s up an average of 1,550 searches.

Overall, there wasn’t a single state that didn’t increase their Googling of Mexico; all states saw greater search volume for “moving to Mexico” this year as compared to 2021.

Some states, however, stand out. In North Carolina, there was a 75% increase in Google searches for “moving to Mexico”. Searches also jumped 65% in Texas and 60% in Florida, respectively.

By contrast, California, where the number of “moving to Mexico” searches is the highest in the country, only saw a Google search increase of 15% in 2022, as compared to last year.

Moving far away?

See prices for container labor – instantly.

Read honest customer reviews.

Book everything online.


All About Affordability: Why Mexico Attracts Expats From Around the World

Mexico is finding itself to be a magnet not only for Americans, but for expats across the globe.

In its Expat Insider 2022 report, Inter Nations — an expat community hub — named Mexico the number one country for expats. Among the aspects that propelled it to the top spot are “affordability” and “ease of settling in”, which both listed Mexico as the very best in the world.


“It’s reasonable to assume remote workers who are giving Mexico a go are likely making use of Mexico’s easy-to-obtain tourist visas, which allow immigrants to stay in the country for up to six months.”


Affordability of housing and medical care are also likely to attract Americans; both are increasingly unaffordable for vast strands of the U.S. population.

Healthcare

A survey commissioned by ExpatsInMexico – an online magazine for foreigners living in Mexico – found that for 75% of expats, $150 per month covers all of their healthcare needs. It’s an attractive proposition for retirees, who make up 80% of the survey respondents and are likely to spend twice that amount, at minimum, if they remained in the United States.

Rent

Rent is another big immigration factor. When in the United States, the average rent is now over $2,000, and growing in over 90% of U.S. cities, the average rent in the four states of Mexico that are top destinations for U.S. immigrants is below $800.

Of the four top destination states, rent is lowest in Jalisco ($720 per month) and Quintana Roo ($735). Rent is slightly higher in Mexico City ($787), and noticeably higher in Baja California Sur ($925). (All figures are expressed in average dollar amount after conversion.)

Sure enough, the houses and apartments Americans moving to are likely to be at the higher end of the price spectrum. But if you consider that most Americans moving to Mexico are retirees, rents this low must be extremely appealing, even if they sold their homes to make the move.


Sources and Methodology
Official immigration statistics come from the Unidad de Política Migratoria – Boletines Estadísticos and were used to estimate the number of Americans moving to Mexico. Only moves requiring either a temporary or a permanent work permit were counted. Military moves were excluded, as were the moves for temporary purposes, such as business and tourism.
The total and average monthly search volumes for the keyword “moving to Mexico” were taken from Google Ads API.
Rent prices for Mexican cities were sourced from Propiedades.com, while the estimates of average rents in the U.S. were taken from Redfin


Illustrations by Lauren Ibañez

2022 Study: Where Americans Are Actually Moving Abroad ????✈️

Author:

Publish Date:

Last Modified Date:

Category: International Moving

Tags: Tags: , , , , , , , , , , , , , , , , , , , , ,

Key Statistics on Americans Moving Abroad:

  • Mexico is the top destination for Americans moving abroad, followed by the U.K., Canada and Australia
  • So far in 2022, ~75% more Americans have moved to Mexico than Canada 
  • Portugal has seen the biggest percentage increase in Americans moving in (+122% from 2019-2021)
  • Japan had the highest % drop of Americans moving in (-53% fewer in 2021 compared to 2019)
  • A five-year low, 2020 saw just under 74,000 Americans relocate abroad
  • Canada, Spain and the U.K. are the most Googled moving destinations this year

In our last study on Americans moving abroad, we detailed the places Americans who leave the country target, as well as explored some of the reasons driving them to leave.

Nearly two years later, now is as great a time as ever to revisit American immigration, given recent high-profile Supreme Court decisions, a spike in the cost of living, and chronically unaffordable housing all among the major issues contributing to a persistent global perception that America is a less desirable place to live.

But what do the numbers say?

In this study, we examine what countries Americans have been moving to, where they’re thinking of moving based on their Google searches, and how both of those trends have been affected by the COVID-19 pandemic.

Going South? Mexico Tops U.K. and Canada as Americans’ Top Destination

Based on the most recent data, over 16,000 U.S. citizens moved to Mexico as temporary or permanent residents in 2021. That’s more than any of the 15 most common destination countries for American moves abroad (more on this later).


“Last year, 34% more Americans relocated to Mexico than to Canada.”


Moves to Mexico outnumber those to the United Kingdom (14,626), and Canada (11,955), which are the second and third most popular destinations. The fourth most popular destination is Australia, where an estimated 7,948 Americans relocated in 2021. 

Spain rounds off the top five, welcoming 7,173 Americans as new residents this year, overtaking other European destinations like France and Germany, as well as countries farther afield, such as Israel, Japan, and New Zealand.

Where to Now? Where Americans Are Ending up in 2022

While the statistics on moves this year haven’t been published by most of the countries we analyzed, we do have specific figures on the number of Americans who moved to Canada, the U.K., and Mexico in 2022.

Some 10,594 Americans moved to Mexico in 2022, which is 75% higher than those who moved to Canada (6,025). And this isn’t the first time Mexico-bound moves outnumber moves to Canada either.

Last year, 34% more Americans relocated to Mexico than to Canada. In the last five years, Mexico attracted an accumulative 13% more U.S. citizens than America’s neighbor to the north.

If migration to Mexico continues at its current pace, the country will receive over 18,000 U.S. citizens as new residents, a new five-year high

Interestingly, more Americans are even moving across the Atlantic to the U.K. than across their northern border. (As many as 8,324 U.S. citizens have relocated to the United Kingdom so far in 2022, which is 38% more than the number of those who moved to Canada.)

Yet while still high, the total tally of Americans moving to the U.K. and Canada in 2022 currently projects at 14,269 and 10,328 respectively—both below their 2021 levels.

Moving far away?

Do it cheaper.


MovingPlace can save up to 40% compared to traditional interstate moving companies. Click here to learn how.

Goodbye, Japan! Hello, Portugal! Unique Trends in U.S. Moves Abroad 

Between 2017-2019, the raw number of Americans moving into one of the top 15 countries we profiled was roughly around 104,000 Americans a year.

The COVID pandemic made a significant dent in that number in 2020, bringing the number down to under 74,000 Americans leaving for new countries, roughly a 29% drop.

Yet as COVID restrictions have eased and vaccination programs have been introduced across the world, moves abroad picked up the pace again in 2021 (the last year for which government data has been released); moves abroad reached 97,806 last year— almost on par with the pre-pandemic years.

Based on countries that published their immigration statistics for 2022, the number of Americans moving to one of the top 15 countries in our analysis may return to six-digit figures by the end of 2022. However, with an estimated 100,975 moves, ex-pats likely will remain just below pre-pandemic levels.

Countries Defying the Numbers

Overall, there are still outlier countries that saw a significant jump in their total of American immigrants during 2021. Chief among them is Portugal, with 2,475 U.S. citizens relocating to this European country last year. That’s ~122% more Americans who moved there than in either 2020 or 2019!


“Canada may not be topping the rankings of move destinations, but it sure dominates moving intent. Americans typed ‘moving to Canada’ into Google approximately 21,000 a month in 2022, far more than similar keywords for other countries.”


Other countries that saw a significant percentage increase in the number of U.S. inbound moves post-pandemic include New Zealand (+78% in 2021 versus 2019), Costa Rica (+47%), and Israel (+40%).

That said, not all countries saw a return to pre-pandemic moving levels. With 2,983 moves last year, U.S. migration to Japan is still 53% below the 2019 levels. (This is no surprise, as the country has only just recently opened its borders to individual tourists.)

Elsewhere, six major countries that are traditionally among the most popular destinations for Americans saw fewer Americans moving to them in 2021 as compared to 2019. These countries are:

  • Italy (-41%)
  • France (-28%)
  • Germany (-24%)
  • Ireland (-21%),
  • U.K. (-20%),
  • South Korea (-16%)

Moving Intent: Most Searched Moving Abroad Destinations in 2022

Canada may not be topping the rankings of move destinations, but it sure dominates moving intent.

Here’s $25 Off Movers

$25 Off Coupon


Americans typed “moving to Canada” into Google approximately 21,000 a month in 2022, far more than similar keywords for other countries.

Surprisingly, the second most searched-for moving destination is not Mexico, but Spain, with 8,100 monthly searches so far this year. It’s just ahead of the three English-speaking countries: the ever-present U.K. (7,670 monthly searches), Australia (5,080), and New Zealand (3,800).

The top 20 most-searched-for-moving destinations are grouped as follows:

Some of these countries have historical ties to the United States, such as Japan (2,850 monthly searches), Ireland (2,140), and the Netherlands (1,190). Yet many are simply known for their relative prosperity and robust social welfare systems, such as Switzerland, Iceland, Germany, Norway, Sweden, and Denmark

Then there are places most known for their warm, pleasant climates and comparatively lower cost of living, like Portugal, Costa Rica, Mexico and Belize.

Lockdown Dreams Vs. COVID Reality: As Intent To Move Abroad Peaked in 2020, Actual Moves Plummeted

After diving deeper into Americans’ plans to move abroad, an interesting trend emerged. The number of searches for keywords around moving abroad was at a five-year high in 2020.

During the first year of the COVID-19 pandemic (also an election year), America saw 102,000 monthly searches related to moving abroad, or to a particular country. This was a whopping 40% increase from the year prior!

However, this five-year high in searches ironically overlapped with a five-year low in actual moves abroad. Again, just under 74,000 Americans moved into one of the top 15 destination countries in 2020. That’s around 30% fewer than in either 2018 or 2019.

In 2021, moving abroad-related searches went back down, with about 28% fewer searches compared to 2020. Yet wanderlust has interestingly recovered in 2022; there have been 92,000 monthly searches for moving abroad, including to specific countries.

While still behind the 2020 peak of Canadian obsession, the current volume of searches is still higher than in the pre-pandemic years.

Mixed Picture: Reasons Why Americans Leave the United States

canada

In absence of hard data, it’s hard to pinpoint the exact reasons that are pushing Americans to move abroad. A recent article in Entrepreneur suggests the recent strengthening of the dollar and the rise of remote work play a part.

Reports in Forbes and Bloomberg both hint that the prospect of home ownership getting further out of reach is what is pushing Americans out of the country. In this vein, remote work and remote-work-specific visas are cited as contributing factors for defectors.

The truth is it’s still too early to definitively tell whether recent political events in the U.S. will shape immigration. However, what we do know is there continues to be an increasing number of reports of young Americans and people of color leaving the country in search of a safer and more equitable place to live.


Sources and Methodology
The top 15 countries outlined in this study are a combination of countries with most U.S. citizens living abroad (based on International Migrant Stock data, see Origin and Destination file) and the countries most searched as destinations for “moving to <insert country>” queries based on Google search volume data for 2022 obtained by Google Ads API. Only moves with stated reasons indicating a certain degree of permanence were analyzed, including work, study and family. Military moves were excluded, as were the moves for temporary purposes, such as temporary business and tourism.
Sources for each country:
Mexico: Unidad de Política Migratoria – Boletines Estadísticos
United Kingdom: Home Office – Managed Migration Datasets
Canada: Immigration, Refugees and Citizenship Canada
Australia: Home Affairs: Visa Statistics
Spain: Ministerio De Inclusión, Seguridad Social y Migraciones – Flujo de Autorizaciones de Residencia Concedidas a Extranjeros
Germany: Federal Statistical Office of Germany 
France: Direction générale des étrangers en France – Chiffres-clés, séjour, visas, éloignements, asile, accès à la nationalité
Ireland: Central Statistics Office – Population and Migration Estimates
South Korea: Statistics Korea – International Migration Statistics
Italy: I.Stat – Permessi di soggiorno dei cittadini stranieri
Israel: Central Bureau of Statistics – Immigration
Japan: e-Stat – Immigration Control Statistics – Status of Residence for Newly Entered Foreigners by Nationality/Region
Portugal: PorData
New Zealand: Ministry of Business, Innovation, and Employment – Migration Statistics
Costa Rica: Dirección General de Migración y Extranjeria – Informes Estadísticos Anuales​
The number of monthly searches was taken from Google Ads API as the total average monthly search volume for keywords of the type “moving to <insert country>” (e.g., “moving to canada”, “moving to mexico” and “moving abroad”.)
Data was collected in September 2022. Browse the data in the interactive table below.
Illustrations by Emma Donnelly

2022 Study: This Is the Most Expensive Year in History To Move

Author:

Publish Date:

Last Modified Date:

Category: Money Saving, Moving Advice

Tags: Tags: , , , , , , , , , , , , , , , , ,

Key Findings:

  • So far in 2022, moving costs are 9% higher than in the same period in 2021
  • In May 2022, the average cost of a move was $427 — 15% higher than in May 2021
  • Moving was at its absolute cheapest during the height of the pandemic (2020; $320 on average) 
  • The average cost of a move is set to reach a high of $454 by August 2022, coinciding with peak demand for moving services
  • Moving in 2022 is more expensive in 39 out of the 45 states in which data is available, with Maine seeing a 51% YoY spike
  • The rise in the cost of moving affects 90 out of 108 cities, most notably Columbia, SC (+42%) and Seattle, WA (+39%)


In May 2022, inflation in the United States reached a 40-year high of 8.6%. That’s the highest it’s been since the recession of 1981, when the economy struggled to shake off the impact of the oil crisis of the late ’70s.

At HireAHelper, we don’t have the data going back decades, but the data we do have shows that the year-on-year increase in the cost of moving is also off the charts. In May 2022, an average move cost $427 — 15% more than a year ago.

And it’s not just a one-off. In the first five months of 2022, moving costs reached an average of $394, which is 9% higher than they were in the same period last year.

In part, that’s down to the rising prices of goods and services that are essential for the moving industry:

You get the picture. On the backdrop of high inflation, the ever-rising gas prices, and increases in costs of trucks and labor, moving costs are also rising to unprecedented levels.

See prices for movers by the hour – instantly.

Read real customer reviews.

Easily book your help online.


Up Since the Pandemic: How the Cost of Moving Changed Over Time

From 2018 to early 2021, the change in the cost of moving was relatively flat; rates would go up only 4% one month, then down 3% the next month.

Then, the global pandemic happened. This forced many to put their moving plans on hold, resulting in the cost of moving services declining for four months straight (February-May 2020). In May that year, the cost of a move on average was $320 — 10% cheaper than the year before and the cheapest it’s been in the last five years.


“Assuming 2022 will look like non-pandemic years in terms of when and how many people move…the average cost of a move will reach a record-high of $454 per move by August.”


As the pandemic eased and vaccinations picked up in 2021, moving activity resumed its typical levels and prices bounced back. During this period, moving costs were up by an average of 15% year-over-year. By August 2021, the cost of moving crossed the $400-mark, averaging $407 per move.


cost of moving over time 2022
(Click here for interactive version)


Since then, the cost of moving ebbed and flowed before reaching an astounding $427 in May of 2022. Way ahead of the inflation rate, the cost of moving is 15% higher than it was this time last year, and 10% higher than just a month ago.

In fact, since January 2021, the cost of moving has only gone up year-on-year. In other words, there hasn’t been a single month in that period where the cost of moving wasn’t higher than it had been 12 months prior. 


cost of move inflation 2022
(Click here for interactive version)

All Over The Place: Where Cost of Moving Soared Highest

Now that we know moving is becoming more expensive nationally, let’s have a look at how the cost of moving has changed in different parts of the country. 

Which states are seeing the greatest jumps in moving prices? In which cities are the moving costs spiking? Are there any states and cities that buck the overall trend?

Based on our figures, those moving in Maine are experiencing the biggest year-over-year spike in cost. The average so far this year is $525, which is some 51% higher than the $350 cost of an average move in the first five months of 2021.

Overall, so far there are five states where moving in 2022 costs a whopping 25% higher or more than during the same period last year. Besides Maine, these states are Nebraska (+30%), Utah (+28%), Alabama (+27%), Idaho (+27%), and Delaware (+26%).


(Click here for interactive version)

There were also five states where the cost of moving remained the same or decreased compared to May 2021. It should be pointed out that the percent decrease was quite marginal in all cases, and only reached a maximum of -6% in New Mexico and -5% in Minnesota.


“On the highest end, Columbia, SC (+42%) and Seattle, WA (+39%) saw an increase in moving costs of around 40% during the first five months of 2022, as compared to 2021.”


Cities followed a similar pattern to states. In 90 out of 108 cities for which there are representative data, we saw a significant increase in how much moving costs in May 2022 compared to in May 2021.

For the majority of cities, the price spike was between 10% and 25%. On the highest end, Columbia, SC (+42%) and Seattle, WA (+39%) saw an increase in moving costs of around 40% during the first five months of 2022, as compared to 2021. 


city by city cost
(Click here for interactive version)


Top among those few cities where moving costs didn’t spike are Rochester, NY (-25%), Knoxville, TN (-22%) and Milwaukee, WI (-15%). Curiously, the cost of moving in New York City stayed the same in 2022 as it was the year before.

High Season: Summer Signals Even Higher Moving Costs

As if it wasn’t high enough already, the cost of moving is likely to rise even more this summer. Partially, this is due to inflation, but to a greater extent, this is also due to the laws of supply and demand.

Peak moving season, i.e., the time of the year when Americans are most likely to move, is routinely observed from June through August. Roughly 40% of all moves that happen during any given year take place during the summer months, meaning that’s when the demand for moving services is the highest.

Moving far away?

Do it cheaper.


MovingPlace can save up to 40% compared to traditional interstate moving companies. Click here to learn how.

This demand is reflected in the increased cost of moving during the summer. Based on our data going back to 2018, moving costs tend to peak in August. (The only exception was 2020 when, for reasons noted above, moving season shifted to autumn and the cost of moving was highest in October.)

What does this mean for 2022? Most likely, despite the already higher costs, moving is likely to get even more expensive as we get into the summer and the height of the moving season.


forecasting move cost 2022
(Click here for interactive version)


Assuming 2022 will look like non-pandemic years in terms of when and how many people move, our forecast suggests that the average cost of a move will reach a record-high of $454 per move by August.

This would make 2022 the most expensive summer for moving in the U.S. by far. Even though the average cost is likely to return to the $400-mark by year’s end, 2022 is projected to be the most expensive year for moving on record.


year on year move cost
(Click here for interactive version)


There’s not much we can do about inflation and rising gas prices, but you can still fight back against rising prices!

First, have a look at our guide to help figure out how much money you should spend on a move. Looking to rent a U-Haul? Check our tips on how to save on your truck rental

And if you are planning to move this summer, be sure to read our advice on how to save money on moving during peak moving season.


Sources and Methodology
All charts and tables are based on the analysis of 233,000 local moves in the U.S. booked through HireAHelper.com and our partners from January 2018 through May 2022.
States and cities with less than 100 moves in the last 12 months were excluded from the state-by-state and city-by-city analysis, respectively. However, calculations of the cost of moving by month of the year or day of the week do include data from all states and cities.

Illustrations by Elizabeth Gu

2022 Study: Are Americans Giving Up on Moving for Love?

Author:

Publish Date:

Last Modified Date:

Category: Moving Stories

Tags: Tags: , , , , , , , , , , , ,

When the late, great Meatloaf sang about doing anything for love — except that — maybe he was referring to moving. 

About one in four adults have moved for love at some point in their lives, according to a 2019 HireAHelper survey. But it appears that far fewer people are doing so today. In 2020, approximately 1,527,685 people moved for romantic reasons. By 2021, that number dropped to 1,067,234, representing a 30% drop. 

It may be that pandemic-era flings are losing their luster, or most everyone interested in shacking up already has. But which generation is most likely to relocate for love? And where are they going?

Here’s a closer look at the current state of moving for love.

Who’s Relocating for Love?

In 2020, the top overall reason for moving was because of a new job or transfer, according to the U.S. Census Bureau. That’s not too surprising, considering more than a third of U.S. workers changed employers or lost their jobs since the start of the pandemic — which is double the normal amount over the past two decades.

But where did romance rank?

“Relationship with unmarried partner” ranked pretty far down the list, at 6% of moves.

In 2021, the top reason for moving was “to establish own household,” followed by “other family reason.” Ending a long-distance relationship was once again a much lower priority, this time representing fewer than 5% of all total moves.

Top Reasons for Moving 2021 vs. 2020
2021 2022
Reason # of Moves % of Moves # of Moves % of Moves
To establish own household 2,878,137 12.8% 3,170,762 12.5%
Other family reason 2,481,267 11.1% 2,596,415 10.2%
For cheaper housing 2,408,044 10.8% 1,977,655 7.8%
New job or job transfer 2,386,871 10.7% 3,399,284 13.4%
Wanted to own home, not rent 2,020,061 9.0% 2,328,100 9.2%
Wanted better neighborhood 1,616,836 7.2% 1,232,599 4.8%
Other housing reason 1,541,679 6.9% 1,888,797 7.4%
Change in marital status 1,287,273 5.7% 1,826,587 7.2%
For easier commute 1,170,450 5.2% 1,464,583 5.8%
Other reasons 1,156,188 5.2% 1,045,606 4.1%
Relationship with unmarried partner 1,067,234 4.8% 1,527,685 6.0%
Attend/leave college 824,236 3.7% 938,023 3.7%
Health reasons 434,010 1.9% 596,470 2.3%
To look for work or lost job 405,254 1.8% 520,348 2.0%
Retired 226,812 1.0% 397,874 1.6%
Change of climate 202,123 0.9% 115,352 0.5%
Foreclosure or eviction 127,983 0.6% 189,659 0.7%
Natural disaster 86,752 0.4% 111,014 0.4%
Other job-related reason 77,548 0.3% 114,439 0.4%

Most moves that occurred because of a relationship with an unmarried partner were local. Sixty percent of those moves took place within the same county. Still, more than a quarter of people who moved for love relocated somewhere else in the state, while 13% moved out of state.

How Far Are People Moving for Love?
Relative move distance Percent of moves for love
Moved within county 60%
Moved within state, different county 27%
Moved between states 13%

When it comes to men and women, moves were pretty evenly split between the two in 2020 and 2021. However, there is one generation that’s far more likely to move for love: millennials.


“Most moves that occurred because of a relationship with an unmarried partner were local.”


Considering that the oldest millennials turn 40 this year, they’re in the prime life stage for finding a forever partner and settling down. Boomers, on the other hand, are pretty unlikely to move for a romantic partner — only 4% of moves for love took place among Boomers last year.


Who’s Moving for Love?
Group 2021 2022
Men 50% 48%
Women 50% 52%
Gen Z 33% 34%
Gen Y (Millennials) 51% 46%
Gen X 12% 13%
Baby Boomers 4% 8%

Where Are People In Love Moving To?

moving for loveWhen we look at where people who moved for love ended up, there are some big differences between states.

The top 10 states that received the newest residents who moved for romantic reasons include Texas, Florida and California. 

This seems reasonable, considering they’re also the largest states in general. However, there were a few smaller states on the list — including North Carolina, Virginia and Tennessee — which also saw a large influx of new residents during the pandemic as people fled high cost-of-living areas.

State Percent of People Moving Who Relocated There for Love
Texas 14.0%
Ohio 9.1%
Illinois 6.8%
Florida 6.5%
North Carolina 6.4%
Virginia 5.9%
Tennessee 5.8%
California 4.9%
Arizona 4.6%
Utah 4.3%

Breaking it down by gender self-identification, the states of Illinois, Florida and North Carolina were the most popular destinations for men who moved for love. Women also favored Illinois, as well as Texas and California.

“In 2020, approximately 1,527,685 people moved for romantic reasons. By 2021, that number dropped to 1,067,234, representing a 30% drop.”


Below, you can see the top 10 states where both men and women moved for love (percentages are based on the entire population of people moving in 2021, according to the US Census Bureau). 

State Percent of Men Who Moved for There for Love
Illinois 9.2%
Florida 8.2%
North Carolina 7.8%
Texas 6.7%
Colorado 4.7%
Pennsylvania 4.5%
California 4.4%
Virigina 4.2%
Ohio 4.1%
Tennessee 4.1%
State Percent of Women Who Moved There for Love
Texas 13.42%
California 6.83%
Illinois 6.33%
Florida 6.12%
Colorado 4.81%
Pennsylvania 4.55%
Tennessee 4.46%
Missouri 4.19%
Michigan 3.82%
Utah 3.55%

As far as the cities where most people landed, the majority weren’t major cities, but smaller towns and the countryside (14.5%). Many more relocated to the Chicago-Naperville-Joliet metro area (IL-IN-WI, 7.6%) and Raleigh-Carey, NC (3.5%). Below is a list of the top 10 metro areas that received the most movers looking for love.

Metro Area Percent of People Moving Who Relocated There for Love
Chicago-Naperville-Joliet, IL-IN-WI 7.6%
Raleigh-Carey, NC 3.5%
Los Angeles-Long Beach-Anaheim, CA 3.0%
Houston-Baytown-Sugar Land, TX 3.0%
Orlando, FL 2.8%
New York-Northern New Jersey-Long Island, NY-NJ-PA 2.4%
St. Louis, MO/IL 1.9%
Austin-Round Rock, TX 1.8%
Dallas-Fort Worth-Arlington, TX 1.8%
Miami-Fort Lauderdale-Miami Beach, FL 1.8%

Methodology
Unless otherwise stated, all the data behind the charts in this study was taken from the U.S. Census Bureau’s Current Population Survey and its Annual Social and Economic Supplements for 2020 and 2021. For the purposes of this study, moves that were made due to “relationship with unmarried partner” (a category introduced by the U.S. Census Bureau in 2020) were catergorized as moves “for love.”
Illustrations by Rachel Tunstall

How Much Does It Cost To Move to California in 2021?

Author:

Publish Date:

Last Modified Date:

Category: Local Moving, Long Distance Moving Advice, Money Saving

Tags: Tags: , , , , , , , , , , , , , , , , , , , ,

California has a lot to offer its residents: beautiful people and beaches, famous attractions, and yearlong sunshine. It’s no wonder people pay a premium to live there (overall, California has the fourth-highest cost of living, behind Hawaii, Washington D.C., and New York).

But how much does moving and living in California cost? Below are moving and price of living costs based on thousands of moves booked through HireAHelper and their affiliates*.

California Moving Costs in 2021

Avg. Cost of a California Move (Labor-only) – $465
Avg. Cost of a California Move (Movers + Truck) – $949
Avg. Cost of a Long-Distance Move w/ CA Destination$5,600 

The average cost of a cross-country move to California is $5,600 according to Unpakt. A long-distance move to California varies wildly in cost, measured by both distance and size of move. You can expect anywhere between $2,000 from a state over, to over $10,000 to move multiple bedrooms from New York City to California. (See how much we can save you.)

Avg. Time and Distance of a California Move – 3 Hours
Avg. Distance of a California Move – 58 Miles

The average length of time of a move that features an origin, destination, or both within California is three hours, while the average distance traveled is just under 58 miles. (Most moves are local.)

How Do These Figures Compare to Other States?

$67 higher, on avg.

The average cost of Californian moving labor services is higher by $67.17, compared to the U.S. as a whole.

Across all move types and services, it costs $397.83 to move locally anywhere within the country, on average.

The national average timeframe for moving is also three hours, and items are transported an average of 36 miles. What service you order for your move makes a difference, though.

The Current State of Moving to California in 2021

moving to california

The previous year (2020) was a big one for moving, thanks in large part to COVID-19. Last year, a quarter of Americans who moved did so because of the pandemic.

With massive business shutdowns, millions of Americans found themselves out of work. In California alone, 2.7 million jobs were wiped out between March and April of 2020. That meant people downsized their living situations to account for decreased income and to absorb new pandemic-era expenses. According to one HireAHelper poll, about 35% of people in the U.S. who moved due to the pandemic cited financial hardship as their main reason for moving.

Millions of people also shifted to remote work—many of whom also had to juggle childcare and remote learning on top of their jobs. While this came with new financial challenges, it also presented the newfound flexibility to move away from major cities where physical offices were located to lower cost-of-living towns, which negatively impacted California’s typical business appeal.

Not too surprisingly, California lost more residents than it gained last year. That’s likely due to its higher tax burden and cost of living in general. Oakland, San Francisco, Los Angeles, and San Jose were the cities that lost the most residents in California. This is not a coincidence; they’re also among the cities with the highest costs of living—not just in California, but the whole country.

In San Francisco, for instance, median home prices are above $1.4 million. A family of four would need $111,136 in household income just to get by.

Moving far away?

Do it cheaper.

HireAHelper.com can save you up to 40%, compared to traditional interstate van lines.

Compare our long distance moving company options.

More 2021 California Moving Stats

Avg. Cost of a Local California Move, by Moving Service

Given multiple moving options available to you, there are many pros and cons to each, including the price. The average California moving service costs in 2021 were as follows:

Transportation Type Avg. Labor Cost Avg. Transportation Cost Total Cost
Container $461 $2,762 $3,223
Truck $478 $345 $823
Freight Trailer $574 $1,500* $2,074**
**Expressed as a national average, as state-specific data is not available.

Avg. Cost of Labor-Only Moving Services in California by Job Type

Hiring labor-only saves people money, but which end of the move you hire for statistically makes a difference. The average cost of moving services by job type versus the U.S. average is as follows:

U.S. Average CA Average
Moving on-site only $309 $328
Moves with only unloading help $343 $451
Moves with only loading help $396 $461
Full move w/ both loading and unloading booked together $573 $727

Least Expensive Long-Distance Move (50+ Miles) in California by Origin/Destination* City (Avg.) 

City Average Move Cost
Chula Vista, CA $516
Burbank, CA $531
Panorama City, CA $637
Santa Ana, CA $648
Vista, CA $672

Most Expensive Long-Distance Move (50+ Miles) in California by Origin/Destination* City (Avg.)

City Average Move Cost
San Jose, CA $1,288
Sacramento, CA $1,252
Fremont, CA $1,129
Hayward, CA $1,109
Long Beach, CA $1,056
*California moves in the above graphs are calculated using booked moves where the origin city, destination city, or both reside within California and are at least 50 miles apart.

Get Help Unloading Your Rental Truck

See prices for movers by the hour—instantly.

Read real customer reviews.

Easily book your help online.


Which Cities in California Are Growing and Shrinking?

Most popular Californian city by population net-gain ratio – El Dorado Hills, CA

This is a rural town just over 20 miles east of the state’s capital, Sacramento, CA.

Least popular Californian city by population net-loss ratio – San Jose, CA

As a major tech hub, it makes sense that workers in the Bay Area, who now have the ability to work from home, might be migrating to states and cities with a cheaper cost of living.

Most Affordable Calfornia Cities (by Median Home Value and Household Income)

Here’s a closer look at how seven of the most affordable cities’ income and housing numbers compare to the state average, according to various sources, including Cost of Living Index and U.S. Census data available as of 2021*.

Median Home Value Median Household Income
Bakersfield $214,600 $63,139
Chico $286,700 $45,337
Clovis $284,200 $68,682
Eureka $249,300 $39,720
Oxnard $390,000 $64,837
Redlands $350,900 $68,956
Temecula $394,600 $87,115
Vacaville $354,600 $77,807
California Avg. $578,267 $80,440
*Based on 2020 Census data expressed in 2019 dollars (2020-21 Census data releases in September 2021)

Cost of Moving WITHIN California (NorCal Versus SoCal)

moving to californiaContrary to popular belief, not everything’s more expensive in SoCal versus NorCal. When comparing the cost of moving in Northern California versus Southern California, there’s virtually no statistical difference. Moving labor costs are roughly $443 in both regions, on average.

That said, Southern California is home to the most expensive city for moving in the entire country: Riverside. On average, state moves originating in Riverside totaled $538, more than anywhere else.

Least Expensive Moves in California by Origin City (Avg.)

City Average Move Cost Region
Oceanside, CA $383 SoCal
Long Beach, CA $395 SoCal
Huntington Beach, CA $402 SoCal
Roseville, CA $414 NorCal
San Diego, CA $415 SoCal
Sacramento, CA $423 NorCal
San Francisco, CA $432 NorCal

Most Expensive Moves in California by Origin City (Avg.)

City Average Move Cost Region
Riverside, CA $538 SoCal
Oakland, CA $487 NorCal
Santa Monica, CA $487 SoCal
Carlsbad, CA $477 SoCal
San Jose, CA $457 NorCal
Los Angeles, CA $454 SoCal
Irvine, CA $437 SoCal

What Are California’s 2021 Tax Rates?

The costs of moving to and within California aren’t just about hiring movers, buying packing supplies, or renting self storage. Your purchases are also subject to income tax, which average particularly high in California, as compared to other states. (And if you’re coming from another state, there could be higher long-term costs of living by moving to California in the form of income taxes.)

Below is a breakdown of California tax rates.

Sales taxes in California include:

  • California sales tax rate: 7.25% (highest in the U.S.)
  • Average local sales tax rate: 1.43%
  • California gasoline tax rate: 60.6¢
  • California cigarette tax rate: $2.87 (per 20-pack)

California income tax rates are as follows:

$1,000,000+$1,000,000+13.30%

Taxable Income
Single  Married Filing Jointly Married Filing Sep. Head of Household Tax Rate
$0 – $8,809 $0 – $17,618 $0 – $8,809 $0 – $17,629 1.00%
$8,809 – $20,883 $17,618 – $41,766 $8,809 – $20,883 $17,629 – $41,768 2.00%
$20,883 – $32,960 $41,766 – $65,920 $20,883 – $32,960 $41,768 – $53,843 4.00%
$32,960 – $45,753 $65,920 – $91,506 $32,960 – $45,753 $53,843 – $66,636 6.00%
$45,753 – $57,824 $91,506 – $115,648 $45,753 – $57,824 $66,636 – $78,710 8.00%
$57,824 – $295,373 $115,648 – $590,746 $57,824 – $295,373 $78,710 – $401,705 9.30%
$295,373 – $354,445 $590,746 – $708,890 $295,373 – $354,445 $401,705 – $482,047 10.30%
$354,445 – $590,742 $708,890 – $1,181,484 $354,445 – $590,742 $482,047 – $803,410 11.30%
$590,742 – $999,999 $1,181,484 – $1,999,999 $590,742 – $999,999 $803,410 – $999,999 12.30%
$1,000,000+ $2,000,000+ $1,000,000+ 13.30%

If you’re considering moving to California, carefully consider the city’s cost of living compared to your salary. Even if you’re moving for a job, it may not be necessary to relocate to one of the big, expensive cities listed above. There are plenty of smaller, more affordable California cities—which aren’t necessarily in the middle of nowhere—including Eureka, Oxnard, Redlands, and Temecula.

And, when you’re ready to book movers in California, use our moving calculator to understand what your own unique moving costs might be.


*Unless otherwise indicated, the previous statistics are based on thousands of moves carried out by the halfway point of 2021. These data points are calculations of average and median costs of “labor-only” and/or “Mover + Truck” moving services booked through HireAHelper.com, as well as “Long Distance Move” moving services from MovingPlace.com, and may also include additional related moving data from industry partners and affiliates collected between 2020 and 2021.
Illustrations by Naomi Ann Clarke
×

I'm Moving

Moving? Thinking about moving? Whether your move is off in the distance or you already have one foot out the door, you'll learn about everything you should expect through our useful how-to's, cool articles and much more. It's all specially curated for you in our "I'm Moving" section.
Explore
×

I'm a Mover

For rookies or veterans alike, our "I'm a Mover" section is filled with extensive industry news, crucial protips and in-depth guides written by industry professionals. Sharing our decade of moving knowledge is just one way we help keep our professional movers at the top of their game.
Explore