How Much Does It Cost To Move to California in 2023?

Author:

Publish Date:

Last Modified Date:

Category: Moving Advice

Tags: Tags: , , , , , , , , , , , , , , , , , , , ,

California has a lot to offer its residents: beautiful beaches, famous attractions, and yearlong sunshine. It’s no wonder people pay a premium to live there (overall, California has the fourth-highest cost of living, behind Hawaii, Washington D.C., and Massachusetts).

But how much does moving and living in California cost? Below are average moving costs based on thousands of moves booked through HireAHelper and their affiliates*.


California Moving Costs in 2023

an illustration of people wandering along a path that winds through huge redwood treesIf you’re moving cross-country from the East Coast to California, you can expect to spend between $2,182 and $10,329 on your move, according to a recent PODS article. The main factors affecting this cost are distance, the moving service you choose, and the size of your move. A shorter move, such as one between Phoenix and L.A., would cost between $328 and $5,300, while the cost of a move from NYC to San Francisco could cost over $10,000

  • Avg. Timeframe for a California Move – 3.4 Hours
  • Avg. Distance of a California Move – 35 Miles

The average time spent on a move that features an origin, destination, or both within California is just shy of three and a half hours, while the average distance traveled is 35 miles.

How Do These Figures Compare to Other States?

The average cost of California moving labor services is $16 more expensive than the national average. Across all move types and services, it costs an average of $396 to move locally anywhere within the country.


“Contrary to popular belief, not everything’s more expensive in SoCal versus NorCal. When comparing the cost of moving in Northern California versus Southern California, there’s virtually no statistical difference. Moving labor costs are roughly $443 in both regions, on average.”


The national average timeframe for moving is three hours (24 minutes shorter than the average California move), and items are transported an average of 74 miles (39 miles farther than the average California move). The specific moving service you use will make a difference, though.

The Current State of Moving to California in 2023

Between April 2020 and July 2022, California lost over 700,000 more residents than it gained, according to the Los Angeles Times. While the pandemic likely played a part in this exodus, the truth is that California residents have been leaving the Golden State for other, more affordable locales since 2000. California has one of the highest costs of living in the nation, and the highest sales tax rate. In San Francisco, for instance, the average home value is above $1.27 million. A family of four would need $112,903 in household income just to get by.

an illustration of a boardwalk next to a Pacific Ocean beach. Colorful homes line the street. With COVID-19 causing many to shift to remote work, employees who were once tied to a desk suddenly had the freedom to find somewhere more affordable to put down roots. 

Still, California has a very large population (over 39 million) and, despite having a net loss of hundreds of thousands of residents between 2020 and 2022, it still managed to rank as the third most moved-in state by volume last year with +3.6% move-ins.

While the cost of living and high taxes may be a turn-off for some, living in California comes with a gorgeous climate, breathtaking scenery, myriad job opportunities, and endless culture and entertainment. People are still moving to the Golden State and, with all of these perks, “California dreaming” isn’t likely going anywhere.

More 2023 California Moving Stats

Given the multiple moving options available to you, each has many pros and cons, including the price. The average California moving service costs in 2023 were as follows:

Transportation Type Avg. Labor Cost Avg. Transportation Cost Total Cost
Container $461 $2,762 $3,223
Truck $478 $345 $823
Freight Trailer $574 $1,500* $2,074**
**Expressed as a national average, as state-specific data is not available.

Avg. Cost of Labor-Only Moving Services in California by Job Type

Hiring labor-only saves people money, but which part of your move you hire the labor for makes a difference. Let’s compare the average costs of different labor-only moving services in California to the national averages.

Type of Labor-Only Moving Service U.S. Average CA Average
Moving with on-site help only $345 $353
Moving with unloading help only $395 $387
Moving with loading help only $400 $398
Moving with both loading and unloading help (booked together) $490 $608

Top 5 Least Expensive Cities for Moves Within California (Labor-Only)

City
(Origin or Destination)
Average Move Cost
(Labor-Only)
Huntington Beach, CA $290
Carlsbad, CA $303
Long Beach, CA $325
San Francisco, CA $336
Corona, CA $341

Top 5 Most Expensive Cities for Moves Within California (Labor-Only)

City
(Origin or Destination)
Average Move Cost
(Labor-Only)
Woodland Hills, CA $689
Camarillo, CA $655
Tracy, CA $595
Redwood City, CA $595
El Dorado Hills, CA $579
California moves in the above graphs are calculated using booked moves where the origin city, destination city, or both reside within California and are at least 50 miles apart.

Which Cities in California Are Growing and Shrinking?

A view of a vineyard that continues into the hills in the distance.
Livermore, CA

Californian City With the Greatest Population Increase*** – Santa Cruz, CA (+12.5%)

This mellow beach town is located in Northern California along Highway One. Among other things, it’s known for its surf culture, whale watching, and close proximity to the Santa Cruz Mountains.

Californian City With the Greatest Population Loss*** – Livermore, CA (-2%)

Located in the San Francisco Bay area and dating back to 1869, Livermore is the state’s oldest wine region. In addition to its thriving wine industry, the city also enjoys a rich arts and culture scene.

***Based on population increase or decrease between July 1, 2021, and July 1, 2022, according to the U.S. Census Bureau.

See prices for local moving labor. Read real customer reviews. Easily book your help online.

Most Affordable California Cities (Based on Cost of Living)

Here’s a closer look at six of the most affordable cities in California (according to Niche) and how their average household incomes and home values compare to the state averages.

City Average Home Value Median Household 

Income

Home Value to Household Income(Ratio)
Visalia, CA $361,827 $69,252 100:19
Bakersfield, CA $370,490 $69,014 100:19
Fresno, CA $359,344 $57,211 100:16
Victorville, CA $403,428 $61,206 100:15
Stockton, CA $419,631 $63,916 100:15
San Bernardino, CA $448,953 $55,372 100:12
California $728,121 $84,097 100:12
Sources: Average home values are based on Zillow data and median household incomes are based on U.S. Census data (expressed in 2021 dollars) available as of June 2022.

Cost of Moving Within California (NorCal Versus SoCal)

A beach in San Diego
San Diego, CA

Contrary to popular belief, not everything’s more expensive in SoCal versus NorCal. When comparing the cost of moving in Northern California versus Southern California, there’s virtually no statistical difference. Moving labor costs are roughly $443 in both regions, on average.

That said, Southern California is home to the most expensive city for moving in the entire country: Riverside. On average, state moves originating in Riverside totaled $538.

Least Expensive Moves in California by Origin City (Avg.)

City Average Move Cost Region
Oceanside, CA $383 SoCal
Long Beach, CA $395 SoCal
Huntington Beach, CA $402 SoCal
Roseville, CA $414 NorCal
San Diego, CA $415 SoCal
Sacramento, CA $423 NorCal
San Francisco, CA $432 NorCal

Most Expensive Moves in California by Origin City (Avg.)

City Average Move Cost Region
Riverside, CA $538 SoCal
Oakland, CA $487 NorCal
Santa Monica, CA $487 SoCal
Carlsbad, CA $477 SoCal
San Jose, CA $457 NorCal
Los Angeles, CA $454 SoCal
Irvine, CA $437 SoCal

What Are California’s 2023 Tax Rates?

The costs of moving to California aren’t just about hiring movers, buying packing supplies, or renting self-storage. If you’re moving from out of state, there’s a good chance the sales tax rates in California will be higher (possibly much higher) than you’re used to, affecting the final cost of moving-related expenses. Not to mention California’s high income taxes, which will almost certainly take a toll on your disposable income.

Below is a breakdown of California tax rates.

Sales taxes in California include:

  • California sales tax rate: 7.25% (highest in the U.S.)
  • Average local sales tax rate: 1.57%
  • California gasoline tax rate: 63¢
  • California cigarette tax rate: $2.87 (per 20-pack)

California income tax rates are as follows:

California Income Tax Brackets Based on Filing Status
Single or Married Filing Separately Married Filing Jointly or Qualifying Widow(er) Head of Household Tax Rate
$0 – $10,099 $0 – $20,198 $0 – $20,212 1%
$10,100 – $23,942 $20,199 – $47,884 $20,213 – $47,887 2%
$23,943 – $37,788 $47,885 – $75,576 $47,888 – $61,730 4%
$37,789 – $52,455 $75,577 – $104,910 $61,731 – $76,397 6%
$52,456 – $66,295 $104,911 – $132,590 $76,398 – $90,240 8%
$66,296 – $338,639 $132,591 – $677,278 $90,241 – $460,547 9.3%
$338,640 – $406,364 $677,279 – $812,728 $460,548 – $552,658 10.3%
$406,365 – $677,275 $812,729 – $1,354,550 $552,659 – $921,095 11.3%
$677,276+ $1,354,551+ $921,096+ 12.3%
Source: H&R Block

If you’re considering moving to California, be sure to look at your new city’s cost of living compared to your salary. Keep in mind that even if you’re moving for a job, it may not be necessary to live in one of the big, expensive cities listed above. There are plenty of affordable California suburbs — which aren’t necessarily in the middle of nowhere — including Morada, Desert Edge, and Golden Hills.

And, when you’re ready to book movers in California, use Hire A Helper’s moving calculator to understand what your own unique moving costs might be.


*Unless otherwise indicated, the previous statistics are based on thousands of moves carried out by the halfway point of 2021. These data points are calculations of average and median costs of “labor-only” and/or “Mover + Truck” moving services booked through HireAHelper.com, as well as “Long Distance Move” moving services from MovingPlace.com, and may also include additional related moving data from industry partners and affiliates collected between 2020 and 2021.

Illustrations by Naomi Ann Clarke

2023 Study: Where, How and Why Are Americans Moving This Year?

Author:

Publish Date:

Last Modified Date:

Category: Local Moving

Tags: Tags: , , , , , , , , , , , , , , , , , , , , , , ,

Key Findings

  • More than half (52%) of all moves in America take place in the summer
  • Our survey findings suggest 40% plan on moving at some point this year
  • ‘Family’ (30%) and ‘Wanting More Space’ (25%) are the top reasons for moving this year
  • A total of 38% are moving for financial reasons, such as inflation, cost of living, and housing unaffordability
  • Climate change is a factor mentioned by 15% of Americans planning to move this year
  • 40% of those moving intend to stay within their city, but 18% are set on moving to a different state
  • More than half (55%) of those not moving this year would move if they had the means


Every year, millions of Americans move, and over half (52%) of those moves take place during what we in the moving business call “moving season” — otherwise known as the summer months of May through August.

So what does the moving season hold for us this year? To get a sense of how many Americans intend to move, when they’re going to move, and what drives their moving decisions, HireAHelper conducted a nationally representative survey of 2,000 adults in the U.S. earlier this month.


“The state most people have their sights on is California, where 11% would move if finances weren’t an issue.”


38% of Americans we surveyed intend to move at some point in 2023, collectively citing “Family“, “Looking for More Space” and “Wanting To Save Money” as the top reasons. A further 35% would move if they could, but find themselves struggling to afford housing where they want to live, or are struggling to afford the move itself.

Let’s delve into the findings and see how Americans look ahead to the 2023 moving season.


Moves in the Making: Four in Ten Americans Plan To Move in 2023

an illustration of someone taping a box. In the corner it's labeled fragileAs we noted earlier, nearly four in ten (40%) of our survey respondents said they are planning to move at some point this year. 

Moving intent is highest among the younger generation, as almost half (49%) of Gen Z respondents reported a planned move for sometime in 2023. And while this intent is still strong with Millennials (42%), it gradually fades with age, and dropping to a reported 27% for Baby Boomers.

Interestingly enough, Parents (41%) are more likely to be planning a move in 2023 than Non-Parents (36%). That said, that only applied to families with one or two kids. For families with three or more children, the percentage of those staying put exceeds the percentage of prospective movers.

Renters (46%) are more likely to be on the move than Homeowners (30%). However, only 25% of renters who are moving expect to own their next home, as 59% of renters reported moving to another rental.

Where are people leaving?

an illustration of white plates and cups being wrapped in brown packing paper. A currently empty cardboard box sits nearbyAmong people living in America’s biggest metropolitan areas, the intent to move is highest in Washington, D.C. (72%) and Los Angeles, CA (55%). There, the majority of residents we surveyed reported having plans to move at some point this year.

In San Francisco, CA (47%), New York, NY (46%), Philadelphia, PA (46%), and Houston, TX (45%), the share of people who reported intent to move this year fell just below half.

Conversely, within the metros of Charlotte, NC (16%), Orlando, FL (32%), and Chicago, IL (32%), the moving intent is the lowest among all metros with a sufficient number of respondents.

At the state level, New Jersey residents seem most keen to move (56%), whereas those in North Carolina (24%) are least likely to relocate in 2023.


Family, Square Footage and Finances: Top Reasons Why Americans Are Moving in 2023

The number one reason for those intending to move this year was reasons related to “Family” (30%), (such as “Being Closer to Family Members,”) with “Wanting More Space or a Bigger Home” (~25%) being the second most popular choice.


“Those who do plan on hiring some help for their move are looking to spend an average of $675…[and those] who expect to move without hired help are looking to keep it at an average of $312.”


However, if we look at the financial reasons, we’ll find that many Americans are moving either because of  “Foreclosure/Eviction” (7.5%), “Can’t Afford (Their) Current Housing” (10.7%), “(Moving Somewhere With) A Lower Cost of Living” (15.3%), or “Inflation” (17.2%).

If we add up all the respondents that said at least one of these financial reasons applies to them, the total share of Americans who intended to move due to financial pressures rose to 38%.

an illustration of a canvas wrapped in bubble wrap. it's stood on top of other packed boxes. Granted, the higher rates of inflation from 2022 seem to have leveled out, but our findings suggest that financial pressures continue to compel a significant number of Americans to relocate.

The financial reasons above were mentioned at the following rates by these demographics:

  • Families with children (40%) compared to childless households (37%)
  • People of color (44%) compared to white Americans (36%)
  • Renters (41%) compared to homeowners (35%)

Other popular reasons for moving in 2023 include “New Job” (16.2%), which, in fact, is more popular than moving due to “(Becoming) Unemployed” (9.8%).

Curiously, and unfortunately, more people are moving due to an “End of a Relationship/Divorce” (10.3%) compared to those moving due to a “New Relationship or Got Married” (7.1%).

an illustration of boxes being moved with a dollyOne significant reason that’s beginning to factor into the moving plans of Americans is “Climate Change” (14.9%), which is in fact distinct from “Want Nicer Weather” (10.4%).

According to estimates based on U.S. Census Bureau data, climate change affects some 20,000 moves per year, with experts suggesting that figure is set to increase.


Getting Practical: Planned Moving Distance and Estimated Cost

Based on our survey responses, 40% of people who are planning to move in 2023 are staying within the same city, while 33% intend to leave their current city, yet still stay within the same state.

Impressively, 18% of respondents intend to move to a different state. Specifically among those respondents, their reasons given were for “Better Weather” (38%), a “New Job” (34%), “Being Closer to Family” (21%), and “Seeking a Lower Cost of Living” (21%).

Thinking about the cost of their move, 44% intend to spend between $100 and $500 on moving, with an overall average being slightly higher at $530. This estimate includes buying moving boxes, potentially renting a truck, maybe hiring movers, etc.

Needless to say, not all Americans who plan on moving intend to hire movers, but 52% of them do, while 48% either intend to execute the move themselves or haven’t decided yet.

Those who do plan on hiring some help for their move are looking to spend an average of $675 between boxes, truck rentals, and movers. Those who expect to move without hired help are looking to keep it at an average of $312. (This figure is in line with nationwide averages of moving costs.)

See prices for local moving labor. Read real customer reviews. Easily book your help online.


Would If I Could: Common Barriers Preventing Americans from Moving

Quite a few Americans are planning to move this year, and the number could have been even higher if it weren’t for certain factors keeping people from moving.

Of those respondents that aren’t moving this year or aren’t sure yet, 55% would move if they had the means and opportunity. The main reason they can’t move? They can’t afford it. People claimed they “Can’t Afford To Move” (58%) or they “Can’t Afford Housing Where (They) Want To Live” (38%).

But it’s not just the financial worries that keep Americans from moving. About a quarter of respondents in our survey who’d move if they could selected “Would Be Too Far Away From (Their) Family” (24%), “Worried About Making a Big Change” (25%) or “Worried It May Not Work Out” (27%), respectively.

Perhaps these concerns, as well as the general decline in the percentage of Americans moving partially explains why, our study found that, on average, Americans now move an average of eight times in their lifetime, down from a 2007 estimate of 11.7 times.


Dream Destinations: Where Would Americans Move if Anything Was Possible

One question we asked in our survey was about the state Americans would move to if money was no object. 

The state most people have their sights on is California, where 11% would move if finances weren’t an issue. Notably, Hawaii and Florida were the dream destinations for 9% of Americans, while New York and Colorado were the top choices for an additional 5% of respondents. 

Texas — a state that’s recently been a popular destination for corporate moves — would also be the go-to place to be for 4% of respondents.

A surprising 4% would leave the United States altogether if they could, but as many as 9% of our respondents would not choose to leave their state, even if money was no object.


Sources and Methodology
All data, unless otherwise stated, have been derived from the findings of the survey HireAHelper ran via Pollfish in May 2023. The survey used a nationally representative sample of 2,000 adults (18+) living in the United States.
Survey results were weighted by age, gender, and income using data extracted from the American Community Survey’s five-year data, collected from ~120,000 households.

Illustrations by Nero Hamaoui

Study: How Much Does Moving Cost in 2023?

Author:

Publish Date:

Last Modified Date:

Category: Moving Advice

Tags: Tags: , , , , , , , , , , , , , , , , , , , , , ,

Key Findings

  • Based on our projections, the cost of moving in 2023 will be 2% lower than in 2022
  • Moving costs are 4% higher so far in 2023 than in the same period last year
  • The average cost of a move is projected to peak at $421 by August 2023, 7% lower than last year’s high of $454
  • Moving costs are spiking highest in New Mexico (+39%), Kentucky (+30%), and Minnesota (+25%) in the first five months of the year
  • Maine (-15%), Rhode Island (-14%), and Oklahoma (-10%) are the states with the lowest cost of moving compared to this time last year
  • Cypress, TX (+39%) and Louisville, KY (+39%) are the cities where the cost of moving is spiking in 2023, compared to last year


When we looked into the cost of moving last year, prices were buoyed by record-high inflation, as well as the rising costs of fuel, cars and trucks; unsurprisingly, moving costs soared to an all-time high. 

Overall, with a peak of $454 in August, the average cost of moving in 2022 was $410 — 7% higher than the year before.

Has it gotten better? Well, based on our figures for the first five months of 2023, the average cost of a move in the United States at the half way point is currently $399, some 4% higher than in the same period last year!

But will the cost of moving in 2023 remain as high all year long, or will costs fall back to Earth? Which states are seeing the most dramatic jumps in moving costs compared to last year? And are there any places where moving is actually getting cheaper?


Still Up on Last Year: How the Cost of Moving Changed Over Time

Based on the moves booked via HireAHelper and our partners in the first five months of the year, moving costs an average of $399, just 2% higher than the $391 we recorded at the same time in 2022.

“…with the projected annual average of $402, the average cost of a move would still be significantly higher than it was before last year, especially before the pandemic.”


That being said, last year we saw the cost soar from $389 in April to $427 in May, a jump which didn’t happen this year; average costs largely lingered around the $400 mark.

While this is good news relative to last year, it’s worth remembering that before and during the pandemic, moving used to cost significantly less, and only started to edge into the $400 or greater territory around late 2021.


More Affordable in Maine, Costlier in Kentucky: Cost of Moving Change by State

As the cost of moving continues to climb upwards at the start of the year, here are the states where movers are most likely to be feeling the pinch.

an illustration of a microscope looking at a miniature home, moving boxes, and a price tag
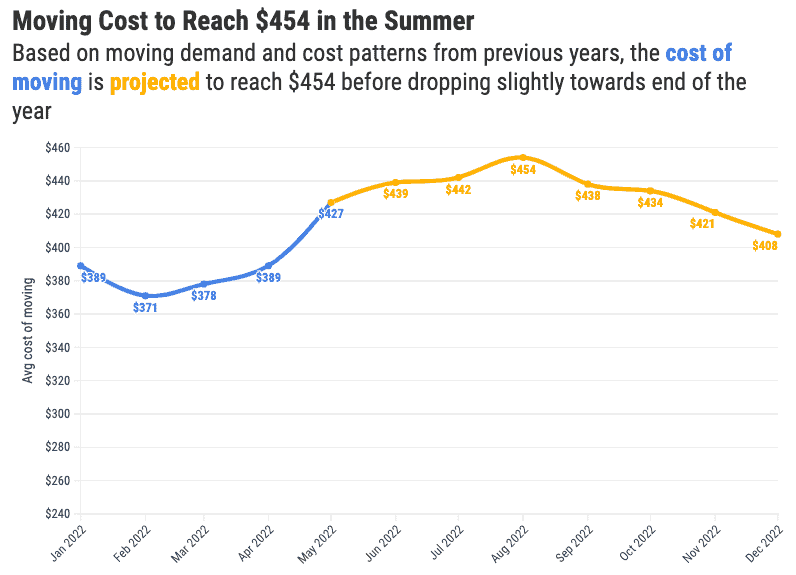
Based on HireAHelper figures for the first five months of 2023, New Mexico (+39%) and Kentucky (+30%), are the states where not only moving costs over 30% more than last year, but also where the average price of moving now exceeds $500.

Similar spikes in the cost of moving are seen in the three Midwestern states, the highest being Minnesota, where the cost of moving went is 25% higher so far this year. 

In Missouri and Wisconsin, the year-over-year increase in moving costs is 17% so far in 2023. Incidentally, Wisconsin is the state with the highest average price of a move this year – $515.

Other states where moving costs are significantly higher this year are Illinois, Massachusetts, and North Carolina. In these states, according to our data, people are paying around 9% more for their move in 2023 than they would at this time last year.

But it’s not all bad news! While the majority of states are seeing the cost of moving go up, there are 13 where it’s gotten cheaper than it was last year.

Maine, the state where the cost of moving spiked 51% last year, currently has the biggest annual decrease in the average move price of -15%. The state with the second-biggest dip in the cost of moving is Oklahoma, where it’s 10% cheaper to move so far this year than it was in 2022.


“…the biggest year-over-year drop in the average cost of a move in Oklahoma City, OK, where the cost of moving is 24% lower so far in 2023.”


Idaho (-9%), Connecticut (-6%), and Utah (-5%) are other states with fairly sizeable reductions in the average cost of a move. States that registered smaller decreases include Tennessee (-4%), Virginia (-2%), and California (-2%)

One possible explanation for prices dropping in these states is cheaper fuel. Based on LendingTree’s recent analysis of fuel price changes, states such as Maine, Rhode Island, Oklahoma, Tennessee, and Virginia saw some of the biggest drops in gas prices so far in 2023.

See prices for local moving labor. Read real customer reviews. Easily book your help online.


Up in Louisville, Down in Oklahoma City: Cost of Moving by City

While our data suggests that nationally the cost of moving is up only 4%, some cities are seeing spikes that far exceed that figure.

In as many as 10 cities, the average amount people pay for their move in 2023 is at least 25% higher than it was at the same time last year. This cost of moving spike is most significant in Louisville, KY (+39%) and Cypress, TX (+39%).

In fact, Louisville, KY is the city where the average cost of a move is the highest overall so far in 2023 and is at $531.

Further down the list, Greensboro, NCIrvine, CA, and Saint Louis, MO registered an annual increase in moving costs of about 33%. 

At the city level, the place with by far the biggest year-over-year drop in the average cost of a move was in Oklahoma City, OK, where the cost of moving has been 24% lower so far in 2023.

Fairfax, VA, Chandler, AZ, and San Diego follow closely, featuring an overall 19% reduction in how much people paid for their moves in the first five months of this year.

Two Texan cities where moving is already among the cheapest in the country, Spring, TX and Katy, TX, registered, respectively, 17% and 15% year-over-year decreases in the cost of moving in 2023.

Check our interactive map showing the change in the cost of moving across states and cities in 2023:


Silver Linings: Moving Should Get (Slightly) Cheaper in 2023

Based on our figures, the cost of moving is projected to drop this year. So far in 2023, the average cost of a standard labor-only move is $399, which is a little higher than in the first five months of last year ($391). 


“…last year we saw the cost soar from $389 in April to $427 in May, which didn’t happen this year, as the costs largely lingered around the $400 mark.”


However, because we have not seen the cost of moving spike from April to May as we did last year, we can project that it’s unlikely to be as high as it was in 2022. This prediction isn’t just based on our data alone.

So far, this year is the first year since 2017 when new and used vehicles are seeing an annual price decrease. Inflation in fuel prices, as well as inflation in the U.S. economy overall is on a downward trajectory, all contributing to the small drop in projected moving prices.

Based on this year’s projections, the price will, again, peak in August when it’s likely to reach an average of $421. But that would be a far cry from last year’s $454 at the height of the moving season.

Similarly, if last year’s cost of moving didn’t dip below $400, this year we project that it will fall to $395 by the end of the year.

All this said, with the projected annual average of $402, the average cost of a move would still be significantly higher than it was before last year, especially before the pandemic.

This is all the more reason to make sure not to overspend on your move. Check out our most recent tips on how to cut moving costs or how to save money if you’re planning on renting a truck for your move. For those of you moving this summer, have a look at our guide to saving money when moving during the peak moving season.


Sources and Methodology
All charts and tables are based on the analysis of 263,000 local moves in the U.S. booked through HireAHelper.com and our partners from January 2018 through May 2023.
States and cities with less than 100 moves in the last 12 months were excluded from the state-by-state and city-by-city analysis, respectively. However, calculations of the cost of moving by month of the year or day of the week do include data from all states and cities.
Illustrations by Shideh Ghandeharizadeh

How To Pack and Protect Your Books During a Move

Author:

Publish Date:

Last Modified Date:

Category: How To Pack, Moving Advice, Organization

Tags: Tags: , , , , , , , , , , , , , , , ,

You’ve spent years building up your home library, adding one book at a time until it’s filled with volumes you’ve read and then read again and — let’s be real here — others that are on your ever-growing to-be-read list (hello, tsundoku!).

If you’re moving, you’ll want your books to come with you. But how do you get them to your new home without damaging them (or your back) in the process?

Packing your books for a move may feel like a daunting task. But if you break it down and go step-by-step, it’ll go more smoothly than you think.

How To Prep Your Books Before You Pack

a couple looks over the books they're packing

Have movers? Lighten your load to save money

Let’s start with the most difficult task: as painful as it may be, it’s time to get into Marie Kondo mode and separate your library into the books you can’t live without, and the ones that’ll spark joy in a new reader’s hands.

Pruning your collection will not only reduce the load you move, but it’ll also reduce your moving costs — fewer boxes to move means lower fees, since your movers can work faster.

If you’re unsure of what to do with the books you’re leaving behind, I suggest donating them or selling them!

Donation

  • Little Free Library is a non-profit organization with volunteer-led book exchange boxes around the world.
  • Goodwill is a non-profit organization that provides educational, career-related, and community-based assistance to those who need it.
  • Better World Books is an online bookseller that sells used and new books, and donates one book to match each sale.

Selling

  • Half Price Books is a bookstore chain with more than 120 stores across the US.
  • Powell’s Books is an independent bookseller in Oregon that sells books nationally through its website (and to select international destinations).
  • Ziffit is an app that readers can use to sell books to them for cash.

Sort and label your books by shelf

a man writes on a clipboard while packing books

Once you’ve got your ‘to keep’ list sorted, it’s time to label your books. Think of this step as a gift to future you; being meticulously organized will make unpacking your books in your new home a whole lot easier.

Make a rough sketch of your bookshelves or storage units and number each shelf. On a Post-it note, write the number assigned to the shelf that a book came from. Stick the note to the inside front cover (or first page) to keep it secure — you don’t want it getting nudged and falling off.

Keep that sketch safe so you’ll know exactly where each book goes when you unpack.

See prices for local moving labor. Read real customer reviews. Easily book your help online.

Hardcore collector? Make an inventory 

Catalog your books to keep track of which ones made the cut. You can use your phone’s notes app to make a simple list of your library and log the title of each book and its author. Alphabetize it (either by title or author) to make it easier to cross-reference the list with the books.

To be extra sure nothing’s missing when you unpack, use the app’s checklist function instead of making a simple list. This way, you can check each book off the list when you take it out of the box and put it on the shelves.

How To Pack Your Books

a woman checks a cardboard box in preparation for packing. There is packing paper inside.

Gather essential book moving gear

Keep your basic packing supplies at hand to make the process faster. 

  • Boxes (more on this below)
  • Packing tape
  • Marker 
  • Acid-free packing paper (for leather-bound, rarer, or delicate books)
  • Tissue paper
  • Silica gel to keep the books free from moisture

Gather dry boxes and wheels

You know when you’re holding a book in your hand, feeling its heft, excited about the world inside it? Now multiply that by dozens or hundreds of books, and you’ll quickly realize it’s less exciting when it comes to moving your books.


“Don’t use newspapers [to pack books], as the ink can smudge onto the covers or fore-edges and damage the[m].”


Pack as many books as possible in something that has wheels, such as a suitcase. For the rest, find smaller cardboard or plastic bins that won’t be too heavy to lift once you add the weight of the books to them.

Make sure any cardboard boxes you use are dry so that moisture doesn’t seep into your books and ruin them.

How to strengthen cardboard boxes

If you’re using cardboard boxes, strengthen the bottom with packing tape so that it doesn’t buckle under the weight of the books. You can tape the box in an H shape so that all openings are tightly sealed. Don’t forget to use double tape for added strength!

Try to find a table on which you can put the boxes while you’re filling them to avoid bending repeatedly. It’ll also be easier to pick up a full box from the table than the floor when it’s time to move it. Your back will thank you!

Always pack your books flat

Sort your books by size and group books with similar heights and widths together. You want to lay them flat in the boxes, building up stacks side-by-side. Don’t fill the boxes with the spines facing either up or down. 

Place the heavier books at the bottom of the box and go lighter as you go up the stack. Try to distribute the weight evenly among the boxes to avoid ending up with some boxes that are much heavier than others.

Fill in the damage-causing gaps in your boxes

a moving box with packing paper in the gaps to protect its contents

While it may seem like no big deal to have some space in the box, any gaps between the books will give the covers wiggle room to move and potentially damage the pages. Stuff these gaps with packing paper to reduce the space between books and protect them from getting damaged.

Note: Don’t use newspapers as the ink can smudge onto the covers or fore-edges and damage the books.

If you’re expecting rain or moving to or from somewhere humid, add some silica gel packets to the boxes (or suitcases) to keep your books dry.

Label the boxes

Once you’ve packed, protected, and sealed the boxes, label them — a simple ‘books’ is good enough. This will save the movers time as they’ll know, at a glance, that the box is heavy and needs to be placed at the bottom of the truck.

To save yourself time while unpacking, label the box with the room the books will live in at your new home.

How To Move Your Books

two movers pack boxes into a truck

Consider transporting them yourself

I get it — books are precious, and you might feel uneasy entrusting someone else with their care. If you have the option, you could move the boxes yourself instead of loading them into the moving truck to give yourself peace of mind.

If you have too many books to transport yourself, pack the ones you’re most attached to in one box (or two) and bring those with you while the rest go with the movers.

See prices for local moving labor. Read real customer reviews. Easily book your help online.

Hire movers

If you do have movers, just make sure to let them know you may have some particularly heavy boxes, or if there are any boxes you consider especially special to you!

Think about how they’ll be stored during the move 

Your books may spend many days in the moving truck, and they need some TLC to come out of the boxes in good condition. Environments that are 70 degrees or lower and have humidity levels of 40 to 50% are the optimal storage conditions — both while moving and in your home or a storage unit. Be sure to let the moving company know what you need at the time of booking a moving truck.


“Pruning your collection will not only reduce the load you move, it’ll also reduce your moving costs — fewer boxes to move means lower fees, since your movers can work faster.”


Direct sunlight and dust can both damage books as well. Make sure you’ve sealed the boxes properly to prevent dust from sneaking in through any small openings. Avoid using boxes that have handle holes for carrying — you’re sending an open invitation to dust and sunlight to enter.

Load them on the moving truck correctly

Books are among the heavier items you’ll be moving, so load the boxes first into the moving truck and place them in the middle. 

Also, keep them as close to the floor of the truck as possible — preferably on the floor, and not stacked above other boxes. This way, the boxes won’t tip over during transport and damage other boxes (or the books themselves) while on the move.


Knowing that you’ve taken care to protect and pack your books means you’ll have one less thing to worry about during the moving process. When you’ve unpacked, curl up on the couch with a good book in your new home — you’ve earned it!

2022 Study: This Is the Most Expensive Year in History To Move

Author:

Publish Date:

Last Modified Date:

Category: Money Saving, Moving Advice

Tags: Tags: , , , , , , , , , , , , , , , , ,

Key Findings:

  • So far in 2022, moving costs are 9% higher than in the same period in 2021
  • In May 2022, the average cost of a move was $427 — 15% higher than in May 2021
  • Moving was at its absolute cheapest during the height of the pandemic (2020; $320 on average) 
  • The average cost of a move is set to reach a high of $454 by August 2022, coinciding with peak demand for moving services
  • Moving in 2022 is more expensive in 39 out of the 45 states in which data is available, with Maine seeing a 51% YoY spike
  • The rise in the cost of moving affects 90 out of 108 cities, most notably Columbia, SC (+42%) and Seattle, WA (+39%)


In May 2022, inflation in the United States reached a 40-year high of 8.6%. That’s the highest it’s been since the recession of 1981, when the economy struggled to shake off the impact of the oil crisis of the late ’70s.

At HireAHelper, we don’t have the data going back decades, but the data we do have shows that the year-on-year increase in the cost of moving is also off the charts. In May 2022, an average move cost $427 — 15% more than a year ago.

And it’s not just a one-off. In the first five months of 2022, moving costs reached an average of $394, which is 9% higher than they were in the same period last year.

In part, that’s down to the rising prices of goods and services that are essential for the moving industry:

You get the picture. On the backdrop of high inflation, the ever-rising gas prices, and increases in costs of trucks and labor, moving costs are also rising to unprecedented levels.

See prices for movers by the hour – instantly.

Read real customer reviews.

Easily book your help online.


Up Since the Pandemic: How the Cost of Moving Changed Over Time

From 2018 to early 2021, the change in the cost of moving was relatively flat; rates would go up only 4% one month, then down 3% the next month.

Then, the global pandemic happened. This forced many to put their moving plans on hold, resulting in the cost of moving services declining for four months straight (February-May 2020). In May that year, the cost of a move on average was $320 — 10% cheaper than the year before and the cheapest it’s been in the last five years.


“Assuming 2022 will look like non-pandemic years in terms of when and how many people move…the average cost of a move will reach a record-high of $454 per move by August.”


As the pandemic eased and vaccinations picked up in 2021, moving activity resumed its typical levels and prices bounced back. During this period, moving costs were up by an average of 15% year-over-year. By August 2021, the cost of moving crossed the $400-mark, averaging $407 per move.


cost of moving over time 2022
(Click here for interactive version)


Since then, the cost of moving ebbed and flowed before reaching an astounding $427 in May of 2022. Way ahead of the inflation rate, the cost of moving is 15% higher than it was this time last year, and 10% higher than just a month ago.

In fact, since January 2021, the cost of moving has only gone up year-on-year. In other words, there hasn’t been a single month in that period where the cost of moving wasn’t higher than it had been 12 months prior. 


cost of move inflation 2022
(Click here for interactive version)

All Over The Place: Where Cost of Moving Soared Highest

Now that we know moving is becoming more expensive nationally, let’s have a look at how the cost of moving has changed in different parts of the country. 

Which states are seeing the greatest jumps in moving prices? In which cities are the moving costs spiking? Are there any states and cities that buck the overall trend?

Based on our figures, those moving in Maine are experiencing the biggest year-over-year spike in cost. The average so far this year is $525, which is some 51% higher than the $350 cost of an average move in the first five months of 2021.

Overall, so far there are five states where moving in 2022 costs a whopping 25% higher or more than during the same period last year. Besides Maine, these states are Nebraska (+30%), Utah (+28%), Alabama (+27%), Idaho (+27%), and Delaware (+26%).


(Click here for interactive version)

There were also five states where the cost of moving remained the same or decreased compared to May 2021. It should be pointed out that the percent decrease was quite marginal in all cases, and only reached a maximum of -6% in New Mexico and -5% in Minnesota.


“On the highest end, Columbia, SC (+42%) and Seattle, WA (+39%) saw an increase in moving costs of around 40% during the first five months of 2022, as compared to 2021.”


Cities followed a similar pattern to states. In 90 out of 108 cities for which there are representative data, we saw a significant increase in how much moving costs in May 2022 compared to in May 2021.

For the majority of cities, the price spike was between 10% and 25%. On the highest end, Columbia, SC (+42%) and Seattle, WA (+39%) saw an increase in moving costs of around 40% during the first five months of 2022, as compared to 2021. 


city by city cost
(Click here for interactive version)


Top among those few cities where moving costs didn’t spike are Rochester, NY (-25%), Knoxville, TN (-22%) and Milwaukee, WI (-15%). Curiously, the cost of moving in New York City stayed the same in 2022 as it was the year before.

High Season: Summer Signals Even Higher Moving Costs

As if it wasn’t high enough already, the cost of moving is likely to rise even more this summer. Partially, this is due to inflation, but to a greater extent, this is also due to the laws of supply and demand.

Peak moving season, i.e., the time of the year when Americans are most likely to move, is routinely observed from June through August. Roughly 40% of all moves that happen during any given year take place during the summer months, meaning that’s when the demand for moving services is the highest.

Moving far away?

Do it cheaper.


MovingPlace can save up to 40% compared to traditional interstate moving companies. Click here to learn how.

This demand is reflected in the increased cost of moving during the summer. Based on our data going back to 2018, moving costs tend to peak in August. (The only exception was 2020 when, for reasons noted above, moving season shifted to autumn and the cost of moving was highest in October.)

What does this mean for 2022? Most likely, despite the already higher costs, moving is likely to get even more expensive as we get into the summer and the height of the moving season.


forecasting move cost 2022
(Click here for interactive version)


Assuming 2022 will look like non-pandemic years in terms of when and how many people move, our forecast suggests that the average cost of a move will reach a record-high of $454 per move by August.

This would make 2022 the most expensive summer for moving in the U.S. by far. Even though the average cost is likely to return to the $400-mark by year’s end, 2022 is projected to be the most expensive year for moving on record.


year on year move cost
(Click here for interactive version)


There’s not much we can do about inflation and rising gas prices, but you can still fight back against rising prices!

First, have a look at our guide to help figure out how much money you should spend on a move. Looking to rent a U-Haul? Check our tips on how to save on your truck rental

And if you are planning to move this summer, be sure to read our advice on how to save money on moving during peak moving season.


Sources and Methodology
All charts and tables are based on the analysis of 233,000 local moves in the U.S. booked through HireAHelper.com and our partners from January 2018 through May 2022.
States and cities with less than 100 moves in the last 12 months were excluded from the state-by-state and city-by-city analysis, respectively. However, calculations of the cost of moving by month of the year or day of the week do include data from all states and cities.

Illustrations by Elizabeth Gu

My Practical Guide to Moving In With a Partner (Romantically and Financially)

Author:

Publish Date:

Last Modified Date:

Category: Movehacks, Moving Stories, Seasonal & Holidays

Tags: Tags: , , , , , , , , , , , , , ,

With Valentine’s Day and the scent of relationship milestones heavy in the air, it’s time to talk about one of the biggest milestones of all: moving in with a romantic partner.

If you’re considering moving in together, my assumption is that you’re already bringing all the love and excitement and ooey-gooey feelings to the situation — which means that it’s my job to bring the practicality, organization, and the cold hard sense. This wretched Virgo thrives on sucking the joy out of situations, replacing it with a structure that will serve you well, far beyond your relationship’s honeymoon phase. (Spoiler alert: in my experience, all that good stuff comes flowing back in once you’ve set up a solid foundation.) 

Here’s a list of some of the un-fun, straight-up, business-like details that have made living with a partner so much better for me.

Decide whether you’re clean-slating-it, or moving into one of your existing spaces

If one of you lives in a two-bedroom alone while the other lives in a lofty attic garret, this is probably a no-brainer. But in my experience, few situations are that simple.

I absolutely loved the studio I was living in when I met my boyfriend, and by the time we moved in together, I’d been living there for seven years. It was basically my longest relationship, outlasting all the boys I’d dated along the way, proving itself reliable in ways they hadn’t been.

Still, my initial thought was that I wanted to start somewhere new with my boyfriend; I wanted to live somewhere neither of us had a history with. Realistically, this was going to create more issues than it solved. For one, my boyfriend had just moved into his roomy one-bedroom a year before, at which point he’d paid a hefty broker’s fee. (This is a cute thing that used to be legal in New York City, and was the bane of our collective existences.)

“…(W)e each ended up saving $630 on rent by moving in together.”

The fact that it made more sense for me to move in with him was staring us in the face, so I asked him for a couple things to make that prospect more comfortable for me.

First, I wanted reassurance that I could bring my own decorating touch to the space, and secondly, I wanted my vote to count a bit more the next time we went apartment-hunting. 

Since I hadn’t had any input in the selection of this current apartment, and it wasn’t a space I was super excited about, it felt only fair that I could weigh in extra on the next one! Happily, my boyfriend agreed. Something we’ve embraced in our relationship is that a compromise doesn’t have to just fall on one person; if there’s something you’re giving up, think about what you’d like to ask in return. Keep it within reason, of course, and don’t try to punish each other when you don’t get your way. But always ask for what you want — the worst your partner can say is no.

Don’t be shy about talking moving costs

We — or rather, I — now had a move to organize. Which was a particularly intimidating prospect after so much time in the same space. I’d been accumulating items around me like a cheerful little magpie for almost a decade, so there was a lot to dig through, get rid of, and sell-off. 

Moving List
This was our actual moving cost list, which we decided to split.

I know my own space and I like things a certain way, so I was happy to take on the labor and organizational side of things. In exchange, my boyfriend offered to split the moving costs with me, which brought a whole range of new options within reach, like rental boxes from Gorilla Bins, and a team of local L.A. movers, which I’d never been able to spring for before.

Since he was getting to miss out on all the most annoying parts of moving, he reasoned, it only made sense that he could contribute to the process financially.

According to my moving spreadsheet (lol), we each paid $577.92, all told. This included the bins, the team, the tip and tolls for the truck, and a mattress and dresser we purchased for our shared space. It might sound high, but I was able to pay down my end by selling big-ticket furniture items that wouldn’t be making the move, and we each ended up saving $630 on rent by moving in together. The whole extravaganza more than paid for itself within just two months.

Get all math-y with how you split rent

valentines catTalking about money can be fraught for me, which I counter by talking about it pretty much all the time to build up my resistance. One area where I still struggle, though, is in asking others for money.

When we first moved in, my boyfriend was making about three times what I did. (Incredibly, data science pays slightly better than freelance writing and bartending.) But for my own reasons, I wasn’t comfortable asking him to pay two-thirds more rent than I was. If you are, that’s great! You should lean into that hard. But if you’re like me, I have a solution for you.

I suggested to my boyfriend that we come at the rent split from a different angle. Aside from the mushy romance stuff, a big part of wanting to move in together was a desire to save money, which is why we ultimately decided to base our rent split not off of what we were spending, but what we were saving. 

With a standard split on our $1,750 Queens one-bedroom, my boyfriend would be saving $875 on what he used to pay, while I’d be saving just $385 on my old $1,260 studio. It was a great amount to be able to bank every month, but I was jealous of my boyfriend’s much larger savings.

“…(W)e ultimately decided to base our rent split not off of what we were spending, but what we were saving.”

To make the split more equitable, we added $875 and $385 together to get our total savings, then divided by two to find the average. The answer was $630, which we subtracted from each of our prior rents. I’d be paying $630, and he’d be paying $1,120. Not quite a two-thirds split, but one I never would’ve felt comfortable asking for without the power of math. 

These days, the gap has closed between our incomes, so now we are able to do a true 50/50 split, but the above method served us well for over a year. I’d highly recommend it to anyone taking the leap to cohabitation.

See prices for movers by the hour – instantly.

Read real customer reviews.

Easily book your help online.


Make your lovely, wonderful significant other sign a dry, unromantic cohabitation agreement

As a child of separation and a graduate into the recession, my fundamental understanding of the world is that most things fall apart (cute!). But I’ve learned to speak my expectations so that others have a chance to respond calmly, or run screaming into the sea. 

Coming into this glorified roommate situation after seven years of solitude, I figured I was probably bringing some pretty serious expectations to the table, so I asked my boyfriend if we could lay out a document spelling them out. Our agreement detailed the aforementioned rent split, what goes down if we break up, and what major responsibilities we’re each expecting from the other in the meantime. 

Some things we considered: 

  • Who buys groceries? Can we eat each other’s food?
    • Answer: we both buy groceries, but he buys more because I cook more. Any food is up for grabs, but there should be communication for specialty items that one of us has been looking forward to.
  • Does one of us like cleaning, or should we maybe spring for a monthly service?
    • Answer: one of us likes cleaning, and it’s me. I do it once a week, and if I need or want anything from my boyfriend, I let him know.
  • If we break up, can I have this couch please?
    • Answer: yes, because I’m the one who designed it and got us a discount on it.
  • Should we get a joint bank account for some of our expenses?
    • Answer: yes, at Simple and then Ally, but let’s keep the majority of our finances separate.
  • Can we please get renters insurance?
    • Answer: yes, an Allstate policy costing $13/month that we’ve transitioned to a USAA policy at $24/month.
  • Which streaming platforms do we want?
    • Answer: unfortunately, all of them. But we’ll cobble them together in a way that makes sure we’re each paying for our fair share.
  • What are your ideal bedtimes and wake up times?
    • Answer: I’m an 11p.m.-7a.m. “bb”, but he’s a 1a.m.-10p.m. angel, so we tried it his way for a while and have now settled on an 11:30p.m.-8:00a.m.-ish situation.
  • How much time do we each need alone?
    • Answer: we decided we each get a minimum of a couple hours a day separate, him to play video games or chat with his friends, and me to play my silly little iPhone games and watch my television stories.
  • How much time do we like to have together?
    • Answer: a lot, but there’s such a thing as too much, so let’s keep an eye on that.
  • Will Judge Judy be impressed with us if she ever reads this?
    • Answer: nothing impresses her, but also yes.

Not every item made the final list, but putting it together gave us each an opportunity to share our biggest needs, wants, and fears about combining our lives, and it ended up being an incredibly productive conversation — one that we revisit every August to make sure we’re both still comfortable and feeling good.

And that feels like a good thing to add here: we are still a couple, and living together quite happily — in a Los Angeles apartment that I got a big vote in picking out — paperwork, uncomfortable conversations and all. We not only like and love each other, but respect each other’s boundaries, which gives me true confidence in the longevity of this match!


Illustrations by Molly Magnell

How Much Does It Cost To Move to California in 2021?

Author:

Publish Date:

Last Modified Date:

Category: Local Moving, Long Distance Moving Advice, Money Saving

Tags: Tags: , , , , , , , , , , , , , , , , , , , ,

California has a lot to offer its residents: beautiful people and beaches, famous attractions, and yearlong sunshine. It’s no wonder people pay a premium to live there (overall, California has the fourth-highest cost of living, behind Hawaii, Washington D.C., and New York).

But how much does moving and living in California cost? Below are moving and price of living costs based on thousands of moves booked through HireAHelper and their affiliates*.

California Moving Costs in 2021

Avg. Cost of a California Move (Labor-only) – $465
Avg. Cost of a California Move (Movers + Truck) – $949
Avg. Cost of a Long-Distance Move w/ CA Destination$5,600 

The average cost of a cross-country move to California is $5,600 according to Unpakt. A long-distance move to California varies wildly in cost, measured by both distance and size of move. You can expect anywhere between $2,000 from a state over, to over $10,000 to move multiple bedrooms from New York City to California. (See how much we can save you.)

Avg. Time and Distance of a California Move – 3 Hours
Avg. Distance of a California Move – 58 Miles

The average length of time of a move that features an origin, destination, or both within California is three hours, while the average distance traveled is just under 58 miles. (Most moves are local.)

How Do These Figures Compare to Other States?

$67 higher, on avg.

The average cost of Californian moving labor services is higher by $67.17, compared to the U.S. as a whole.

Across all move types and services, it costs $397.83 to move locally anywhere within the country, on average.

The national average timeframe for moving is also three hours, and items are transported an average of 36 miles. What service you order for your move makes a difference, though.

The Current State of Moving to California in 2021

moving to california

The previous year (2020) was a big one for moving, thanks in large part to COVID-19. Last year, a quarter of Americans who moved did so because of the pandemic.

With massive business shutdowns, millions of Americans found themselves out of work. In California alone, 2.7 million jobs were wiped out between March and April of 2020. That meant people downsized their living situations to account for decreased income and to absorb new pandemic-era expenses. According to one HireAHelper poll, about 35% of people in the U.S. who moved due to the pandemic cited financial hardship as their main reason for moving.

Millions of people also shifted to remote work—many of whom also had to juggle childcare and remote learning on top of their jobs. While this came with new financial challenges, it also presented the newfound flexibility to move away from major cities where physical offices were located to lower cost-of-living towns, which negatively impacted California’s typical business appeal.

Not too surprisingly, California lost more residents than it gained last year. That’s likely due to its higher tax burden and cost of living in general. Oakland, San Francisco, Los Angeles, and San Jose were the cities that lost the most residents in California. This is not a coincidence; they’re also among the cities with the highest costs of living—not just in California, but the whole country.

In San Francisco, for instance, median home prices are above $1.4 million. A family of four would need $111,136 in household income just to get by.

Moving far away?

Do it cheaper.

HireAHelper.com can save you up to 40%, compared to traditional interstate van lines.

Compare our long distance moving company options.

More 2021 California Moving Stats

Avg. Cost of a Local California Move, by Moving Service

Given multiple moving options available to you, there are many pros and cons to each, including the price. The average California moving service costs in 2021 were as follows:

Transportation Type Avg. Labor Cost Avg. Transportation Cost Total Cost
Container $461 $2,762 $3,223
Truck $478 $345 $823
Freight Trailer $574 $1,500* $2,074**
**Expressed as a national average, as state-specific data is not available.

Avg. Cost of Labor-Only Moving Services in California by Job Type

Hiring labor-only saves people money, but which end of the move you hire for statistically makes a difference. The average cost of moving services by job type versus the U.S. average is as follows:

U.S. Average CA Average
Moving on-site only $309 $328
Moves with only unloading help $343 $451
Moves with only loading help $396 $461
Full move w/ both loading and unloading booked together $573 $727

Least Expensive Long-Distance Move (50+ Miles) in California by Origin/Destination* City (Avg.) 

City Average Move Cost
Chula Vista, CA $516
Burbank, CA $531
Panorama City, CA $637
Santa Ana, CA $648
Vista, CA $672

Most Expensive Long-Distance Move (50+ Miles) in California by Origin/Destination* City (Avg.)

City Average Move Cost
San Jose, CA $1,288
Sacramento, CA $1,252
Fremont, CA $1,129
Hayward, CA $1,109
Long Beach, CA $1,056
*California moves in the above graphs are calculated using booked moves where the origin city, destination city, or both reside within California and are at least 50 miles apart.

Get Help Unloading Your Rental Truck

See prices for movers by the hour—instantly.

Read real customer reviews.

Easily book your help online.


Which Cities in California Are Growing and Shrinking?

Most popular Californian city by population net-gain ratio – El Dorado Hills, CA

This is a rural town just over 20 miles east of the state’s capital, Sacramento, CA.

Least popular Californian city by population net-loss ratio – San Jose, CA

As a major tech hub, it makes sense that workers in the Bay Area, who now have the ability to work from home, might be migrating to states and cities with a cheaper cost of living.

Most Affordable Calfornia Cities (by Median Home Value and Household Income)

Here’s a closer look at how seven of the most affordable cities’ income and housing numbers compare to the state average, according to various sources, including Cost of Living Index and U.S. Census data available as of 2021*.

Median Home Value Median Household Income
Bakersfield $214,600 $63,139
Chico $286,700 $45,337
Clovis $284,200 $68,682
Eureka $249,300 $39,720
Oxnard $390,000 $64,837
Redlands $350,900 $68,956
Temecula $394,600 $87,115
Vacaville $354,600 $77,807
California Avg. $578,267 $80,440
*Based on 2020 Census data expressed in 2019 dollars (2020-21 Census data releases in September 2021)

Cost of Moving WITHIN California (NorCal Versus SoCal)

moving to californiaContrary to popular belief, not everything’s more expensive in SoCal versus NorCal. When comparing the cost of moving in Northern California versus Southern California, there’s virtually no statistical difference. Moving labor costs are roughly $443 in both regions, on average.

That said, Southern California is home to the most expensive city for moving in the entire country: Riverside. On average, state moves originating in Riverside totaled $538, more than anywhere else.

Least Expensive Moves in California by Origin City (Avg.)

City Average Move Cost Region
Oceanside, CA $383 SoCal
Long Beach, CA $395 SoCal
Huntington Beach, CA $402 SoCal
Roseville, CA $414 NorCal
San Diego, CA $415 SoCal
Sacramento, CA $423 NorCal
San Francisco, CA $432 NorCal

Most Expensive Moves in California by Origin City (Avg.)

City Average Move Cost Region
Riverside, CA $538 SoCal
Oakland, CA $487 NorCal
Santa Monica, CA $487 SoCal
Carlsbad, CA $477 SoCal
San Jose, CA $457 NorCal
Los Angeles, CA $454 SoCal
Irvine, CA $437 SoCal

What Are California’s 2021 Tax Rates?

The costs of moving to and within California aren’t just about hiring movers, buying packing supplies, or renting self storage. Your purchases are also subject to income tax, which average particularly high in California, as compared to other states. (And if you’re coming from another state, there could be higher long-term costs of living by moving to California in the form of income taxes.)

Below is a breakdown of California tax rates.

Sales taxes in California include:

  • California sales tax rate: 7.25% (highest in the U.S.)
  • Average local sales tax rate: 1.43%
  • California gasoline tax rate: 60.6¢
  • California cigarette tax rate: $2.87 (per 20-pack)

California income tax rates are as follows:

$1,000,000+$1,000,000+13.30%

Taxable Income
Single  Married Filing Jointly Married Filing Sep. Head of Household Tax Rate
$0 – $8,809 $0 – $17,618 $0 – $8,809 $0 – $17,629 1.00%
$8,809 – $20,883 $17,618 – $41,766 $8,809 – $20,883 $17,629 – $41,768 2.00%
$20,883 – $32,960 $41,766 – $65,920 $20,883 – $32,960 $41,768 – $53,843 4.00%
$32,960 – $45,753 $65,920 – $91,506 $32,960 – $45,753 $53,843 – $66,636 6.00%
$45,753 – $57,824 $91,506 – $115,648 $45,753 – $57,824 $66,636 – $78,710 8.00%
$57,824 – $295,373 $115,648 – $590,746 $57,824 – $295,373 $78,710 – $401,705 9.30%
$295,373 – $354,445 $590,746 – $708,890 $295,373 – $354,445 $401,705 – $482,047 10.30%
$354,445 – $590,742 $708,890 – $1,181,484 $354,445 – $590,742 $482,047 – $803,410 11.30%
$590,742 – $999,999 $1,181,484 – $1,999,999 $590,742 – $999,999 $803,410 – $999,999 12.30%
$1,000,000+ $2,000,000+ $1,000,000+ 13.30%

If you’re considering moving to California, carefully consider the city’s cost of living compared to your salary. Even if you’re moving for a job, it may not be necessary to relocate to one of the big, expensive cities listed above. There are plenty of smaller, more affordable California cities—which aren’t necessarily in the middle of nowhere—including Eureka, Oxnard, Redlands, and Temecula.

And, when you’re ready to book movers in California, use our moving calculator to understand what your own unique moving costs might be.


*Unless otherwise indicated, the previous statistics are based on thousands of moves carried out by the halfway point of 2021. These data points are calculations of average and median costs of “labor-only” and/or “Mover + Truck” moving services booked through HireAHelper.com, as well as “Long Distance Move” moving services from MovingPlace.com, and may also include additional related moving data from industry partners and affiliates collected between 2020 and 2021.
Illustrations by Naomi Ann Clarke

Every Major Moving Report of 2017 Analyzed: Where Is Everybody Going?

Author:

Publish Date:

Last Modified Date:

Category: Moving Industry News

Tags: Tags: , , , , , , , , , , , , , , , , , , , , , , , , ,

Migration reports are out in full force, including the famous United Van Lines yearly report.

But while United handles more moves annually than any other mover network in the country, their numbers are not definitive across the industry board.

North American, Atlas and Allied all see slightly – and in some cases, wildly – different results in their migration study results. Not a surprise, because as a Full Service move provider, United handles a somewhat different clientele compared to companies like ABF, U-Haul and PODS – companies whose numbers might look a lot different. Then there’s that little thing called the Census.

Yep, the state-to-state migration numbers for 2017 are out – and folks, we have new inbound state championsHere are the results:

United Van Lines

Vermont Takes United 2017 Inbound Crown

In 2015 they came in at third on the inbound rankings. In 2016 they inched their way up to number two. Now, this tiny state known mainly for skiing and maple syrup has captured the coveted top inbound spot on United’s 2017 National Movers Study.

Yes, the champagne is indeed flowing like syrup in Stowe, Killington and Montpelier as Vermont looks back on a year that saw a whopping 68% of their interstate moves coming in. 

Reasons

According to United’s survey, “family” was the most common reason respondents gave for relocating to the Green Mountain State. Retirement, lifestyle and job also figured fairly evenly into the equation.

On the other hand, a full 75% of people moving out of state gave employment as their reason. This helps explain why half of all outbounders fell into the Under-35 age category – and another 25% were between 35 and 45 – while 40% of those moving into the state were 65 or older.

Those mountains may be green, but with those unemployment numbers, it looks like the valleys are starting to turn gray.

But before we start replacing all those ski lifts with wheelchair-friendly escalators, let’s take a step back and look a little closer at where the stats behind Vermont’s inbound crown come from. Keep in mind we don’t know how many moves Vermont actually saw by their report. (68% can be broken down to 17 inbound moves and 8 outbound moves – which hardly amounts to a mass migration to this land of wooden bridges and Bernie Sanders.)

Inbound:

1. Vermont
2. Oregon
3. Idaho
4. Nevada
5. South Dakota
6. Washington
7. South Carolina
8. North Carolina
9. Colorado
10. Alabama

This past year saw some familiar names on United’s Top Ten Inbound States list. Oregon, Nevada and North Carolina are all there, as they have been every year since 2011. Washington, Idaho, South Dakota, South Carolina and Arizona are also back after making 2016’s inbound list. Newcomers include Alabama and Colorado. Meanwhile, Florida has dropped off the inbound list after a strong three-year run.

This past year’s top inbound states are also fairly spread out around the country. The same cannot be said about United’s outbound states.

Outbound:

1. Illinois
2. New Jersey
3. New York
4. Connecticut
5. Kansas
6. Massachusetts
7. Ohio
8. Kentucky
9. Utah
10. Wisconsin

As with the previous few years, the major exodus seems to be coming out of the Northeast and the Midwest, with Utah adding a little “outbound yellow” to the otherwise blue western region on United’s interactive migration map.

Perennial outbound states New York, New Jersey, Connecticut and Illinois have been the most unfortunate ones; we’d have to go back to 2010 to see any of them as balanced. (New York and Connecticut were both spared the shame that year).

North American Moving Services

northamerican.com

Arizona Takes North Americans 2017 Inbound Crown

North American’s inbound champ is Arizona, with 67% of their interstate moves coming into the Grand Canyon State. Other top inbounders not on United’s list include Tennessee, Florida, Georgia and Texas – all south and southeast states. (Those North American drivers must really love the south.)

Inbound:

  1. Arizona
  2. Idaho
  3. North Carolina
  4. South Carolina
  5. Tennessee

Outbound:

  1. Illinois
  2. Connecticut
  3. New Jersey
  4. California
  5. Michigan

Like United, North American has Illinois, New Jersey and Connecticut at the top of their outbound list (with New York a notable #8). But the rest of their top outbounders – California, Michigan, Pennsylvania, Minnesota and Maryland (#4-8 on the map) aren’t even on United’s radar.

Interestingly, North American’s #10 outbounder is Washington, which ranks #6 on United’s inbound list.

In accounting for these discrepancies, it is worth noting what North American says of their report’s methodology:

We define the top inbound and outbound states as those that have the highest proportion of moves where the absolute value difference of inbound and outbound moves is greater than or equal to 400. This weeds out states that had a small number of moves but would have a high ratio of inbound/outbound moves.”

This may explain why United’s 2017 champ Vermont and #5 South Dakota (United’s #1 in 2016 by the way) aren’t anywhere on North American’s Top Ten.

Atlas Van Lines

atlasvanlines.com

Washington Takes Atlas 2017 Inbound Crown

Atlas Van Lines offers some relative surprises too. Idaho, Washington and Nevada as their top three inbounders may not raise any eyebrows. But Alaska, Maine and New Hampshire at #5, #6 and #10? Oregon is a familiar name, but seeing them at #8 seems in contrast to their recent United Van Lines inbound championships.

Atlas’s top outbounder, meanwhile, is Illinois (same as both United and North American – those Fighting Illini have a real stranglehold on that top spot!). And their #2, West Virginia, was a strong outbounder for United for six years straight before balancing out in 2017.

But Nebraska at #3? Nebraska has been balanced for United since 2001! And #4 outbounder South Dakota has been an inbound darling for United the past three years.

Rounding out the Atlas top outbound list are Hawaii, Indiana, Delaware and Louisiana, all of them somewhat surprising since three of them have spent the last ten years on United’s “balanced” register. Only Indiana has managed to make a blip on United’s outbound radar in that time frame.

Inbound:

  1. Idaho
  2. Washington
  3. Nevada
  4. Tennessee
  5. Alaska
  6. Maine
  7. North Carolina
  8. Oregon
  9. Alabama
  10. New Hampshire

Outbound:

  1. Illinois
  2. West Virginia
  3. Nebraska
  4. South Dakota
  5. Hawaii
  6. Indiana
  7. Delaware
  8. New York
  9. Louisiana
  10. Kansas

In contrast to the percentages United and North American provide, Atlas gives actual numbers of inbound and outbound moves for each state. Here we see that Vermont has seen just a fraction of the moves so many other states see, so it’s easy to imagine why they wouldn’t have made it onto North American’s list. (Meanwhile, once again, Canada’s Yukon Territory has seen zero moves. We’ll blame it on the roads.)

Allied Van Lines

allied.com

Florida Takes Allied 2017 Inbound Crown

Allied Van Lines keeps it all very short and sweet. They report only their top fives:

Inbound:

  1. Florida
  2. Arizona
  3. North Carolina
  4. South Carolina
  5. Texas

Outbound:

  1. California
  2. Illinois
  3. Pennsylvania
  4. New Jersey
  5. Michigan

Based on this limited report, we’re able to come to at least one solid conclusion: Allied’s drivers love moving people south even more than North American’s do.

U-Haul

Texas Takes U-Haul 2017 Inbound Crown

Because news outlets predominately focus on Full Service van lines, it can easily be argued this eliminates an entire sector of the migrating public. (In fact, Full Service van lines actually conduct less than half of all moves performed in the US every year.)

Do U-Haul’s numbers reflect what the van lines suggest are moving trends?

Nope.

Inbound:

  1. Texas
  2. Florida
  3. Arkansas
  4. South Carolina
  5. Tennessee
  6. Washington
  7. North Carolina
  8. Connecticut
  9. Colorado
  10. Vermont

Outbound:

  1. California
  2. Illinois
  3. Pennsylvania
  4. Michigan
  5. Massachusetts
  6. New Jersey
  7. New York
  8. Arizona
  9. Maryland
  10. Georgia

Texas tops U-Haul’s 2017 Growth States list. This shouldn’t come as a huge surprise, as Texas has fared well recently in the inbound-outbound game. In 2017 their inbound percentages with United, North American and Atlas were 54, 53 and 53, while Allied put Texas down as their fifth biggest inbound state.

Oddly, Texas won U-Haul’s Growth State crown by bringing in – get this – a whopping 50.3% of all one-way truck rental traffic crossing Texas’s borders. That’s right. Fifty. Point. Three.

This hardly lends a whole lot more understanding to the migration trends we’re trying to dissect. But here we are, so let’s keep moving.

U-Haul rounds out its top five Growth States with Florida, Arkansas, South Carolina and Tennessee. Yes, Arkansas – which has been balanced on United’s report 37 of the last 40 years. Then again, Arkansas remained balanced in 2017 on United’s ledger with a 54% outbound rate, so that they are U-Haul’s #3 Growth State is rather surprising no matter how minuscule their positive U-Haul balance might have been.

And who comes in at #8 on U-Haul’s list? That big loser with United and North American (but not with Atlas), Connecticut.

On the flip side, U-Haul has Colorado at #9 – exactly where United and North American have them.

United States Census Bureau

Idaho Takes United States Census Bureau 2017 Inbound Crown

Yes, the Bureau has all the moving numbers we could possibly want. So many, in fact, that it could take until next January to weed through them all.

But thanks to Business Insider we don’t have to.

In this piece with the strangely long title: While the Bureau considers “a variety of components” in determining what’s happening among the more than 325 million people who make up the US population, Business Insider brings us what we need: domestic migration.

Here we see the net population gain or loss for each state for 2017. Births, deaths and international immigration are not counted; this is simply and strictly an account of how many people moved into or out of each state. (Again, not moves, but individual people.)

Inbound:

  1. Idaho
  2. Nevada
  3. South Carolina
  4. Oregon
  5. Arizona
  6. Washington
  7. Montana
  8. Florida
  9. Colorado
  10. North Carolina

And in this, the winner is Idaho, with a net domestic migration gain of 14.6 people per 1,000 residents. In second place comes Nevada, with South Carolina, Oregon and Arizona rounding out the top five. The second half of the big ten winners are Washington, Montana, Florida, Colorado and North Carolina.

These results actually mirror the van lines’ findings to a striking degree. Only Arizona, Montana and Florida don’t show up in United’s top ten. Seven of the Census top ten are also on North American’s top ten. Unbelievably, Colorado is #9 on all three lists.

As for the Net Domestic Migration losers? Yes, Illinois is up there, but at #5, maybe this is the survey they should be talking about in Chicago.

Outbound:

  1. Wyoming
  2. Alaska
  3. New York
  4. Hawaii
  5. Illinois
  6. North Dakota
  7. New Jersey
  8. Connecticut
  9. Louisiana
  10. West Virginia

The big loser in the 2017 migration tournament is Wyoming, a surprise since the Equality State doesn’t show up on any van line outbound lists – or inbound for that matter. United had them at 53% inbound for 2017. North American had them at 54% in. Only Atlas has them as outbound – based on a grand total of 330 moves.

The Bureau’s next three biggest net migration losers are Alaska, New York and Hawaii. Alaska and Hawaii, neither of which show up anywhere for United or North American, are Atlas’s #5 inbound and #5 outbound, respectively. North Dakota, New Jersey, Connecticut, Louisiana and West Virginia complete the Bureau’s top ten.

Again, while there are outbound wild cards, we still see some consistency between the Bureau and the van lines. Atlas and the Bureau actually have seven migration losers in common between their top tens. Looking at the US Census Bureau’s Net Domestic Migration map we can clearly see the winners clustered in the south and west with the losers dominating the northeast and midwest.

What’s The Takeaway?

Remember, the numbers put together by each of the van lines represent the migration trends among the customers they’ve served. Van lines count moves, the Bureau counts people.

This may not account for the reason United’s inbound champion Vermont is somehow a net loser according to the Census Bureau’s numbers, but it does suggest that, despite the discrepancies, the van lines and the Census Bureau can give a decent overall on what is going on out there.

But in the cases where data remains too contradictory to be meaningful, evaluating regions rather than individual states might give us a slightly more reliable picture of the migration trends playing out across the US. At the end of the day, we are only looking at a mere slice of the American migratory pie.

There’s More Realistic Data Out There

We need another, more encompassing way to look at where America is moving to and from.

DIY Moves and Hybrid Moves (besides U-Haul), which by far and away are the more common ways to move, are sorely misrepresented. When you move, do you routinely call up $2,000+ movers? Have you ever saved money by having your friends move you? What are these Full Service reports actually reflecting?

That’s something to keep in mind when the local news sounds off on “moving trends” based off a single Full Service Moving company’s report. 

×

I'm Moving

Moving? Thinking about moving? Whether your move is off in the distance or you already have one foot out the door, you'll learn about everything you should expect through our useful how-to's, cool articles and much more. It's all specially curated for you in our "I'm Moving" section.
Explore
×

I'm a Mover

For rookies or veterans alike, our "I'm a Mover" section is filled with extensive industry news, crucial protips and in-depth guides written by industry professionals. Sharing our decade of moving knowledge is just one way we help keep our professional movers at the top of their game.
Explore