Moving During Delta: How COVID Affected American Moves in 2021 (so Far)

Author:

Publish Date:

Last Modified Date:

Category: Moving Advice, Moving Stories

Tags: Tags: , , , , , , , , , , , , , , , , , , , , ,

Key Findings

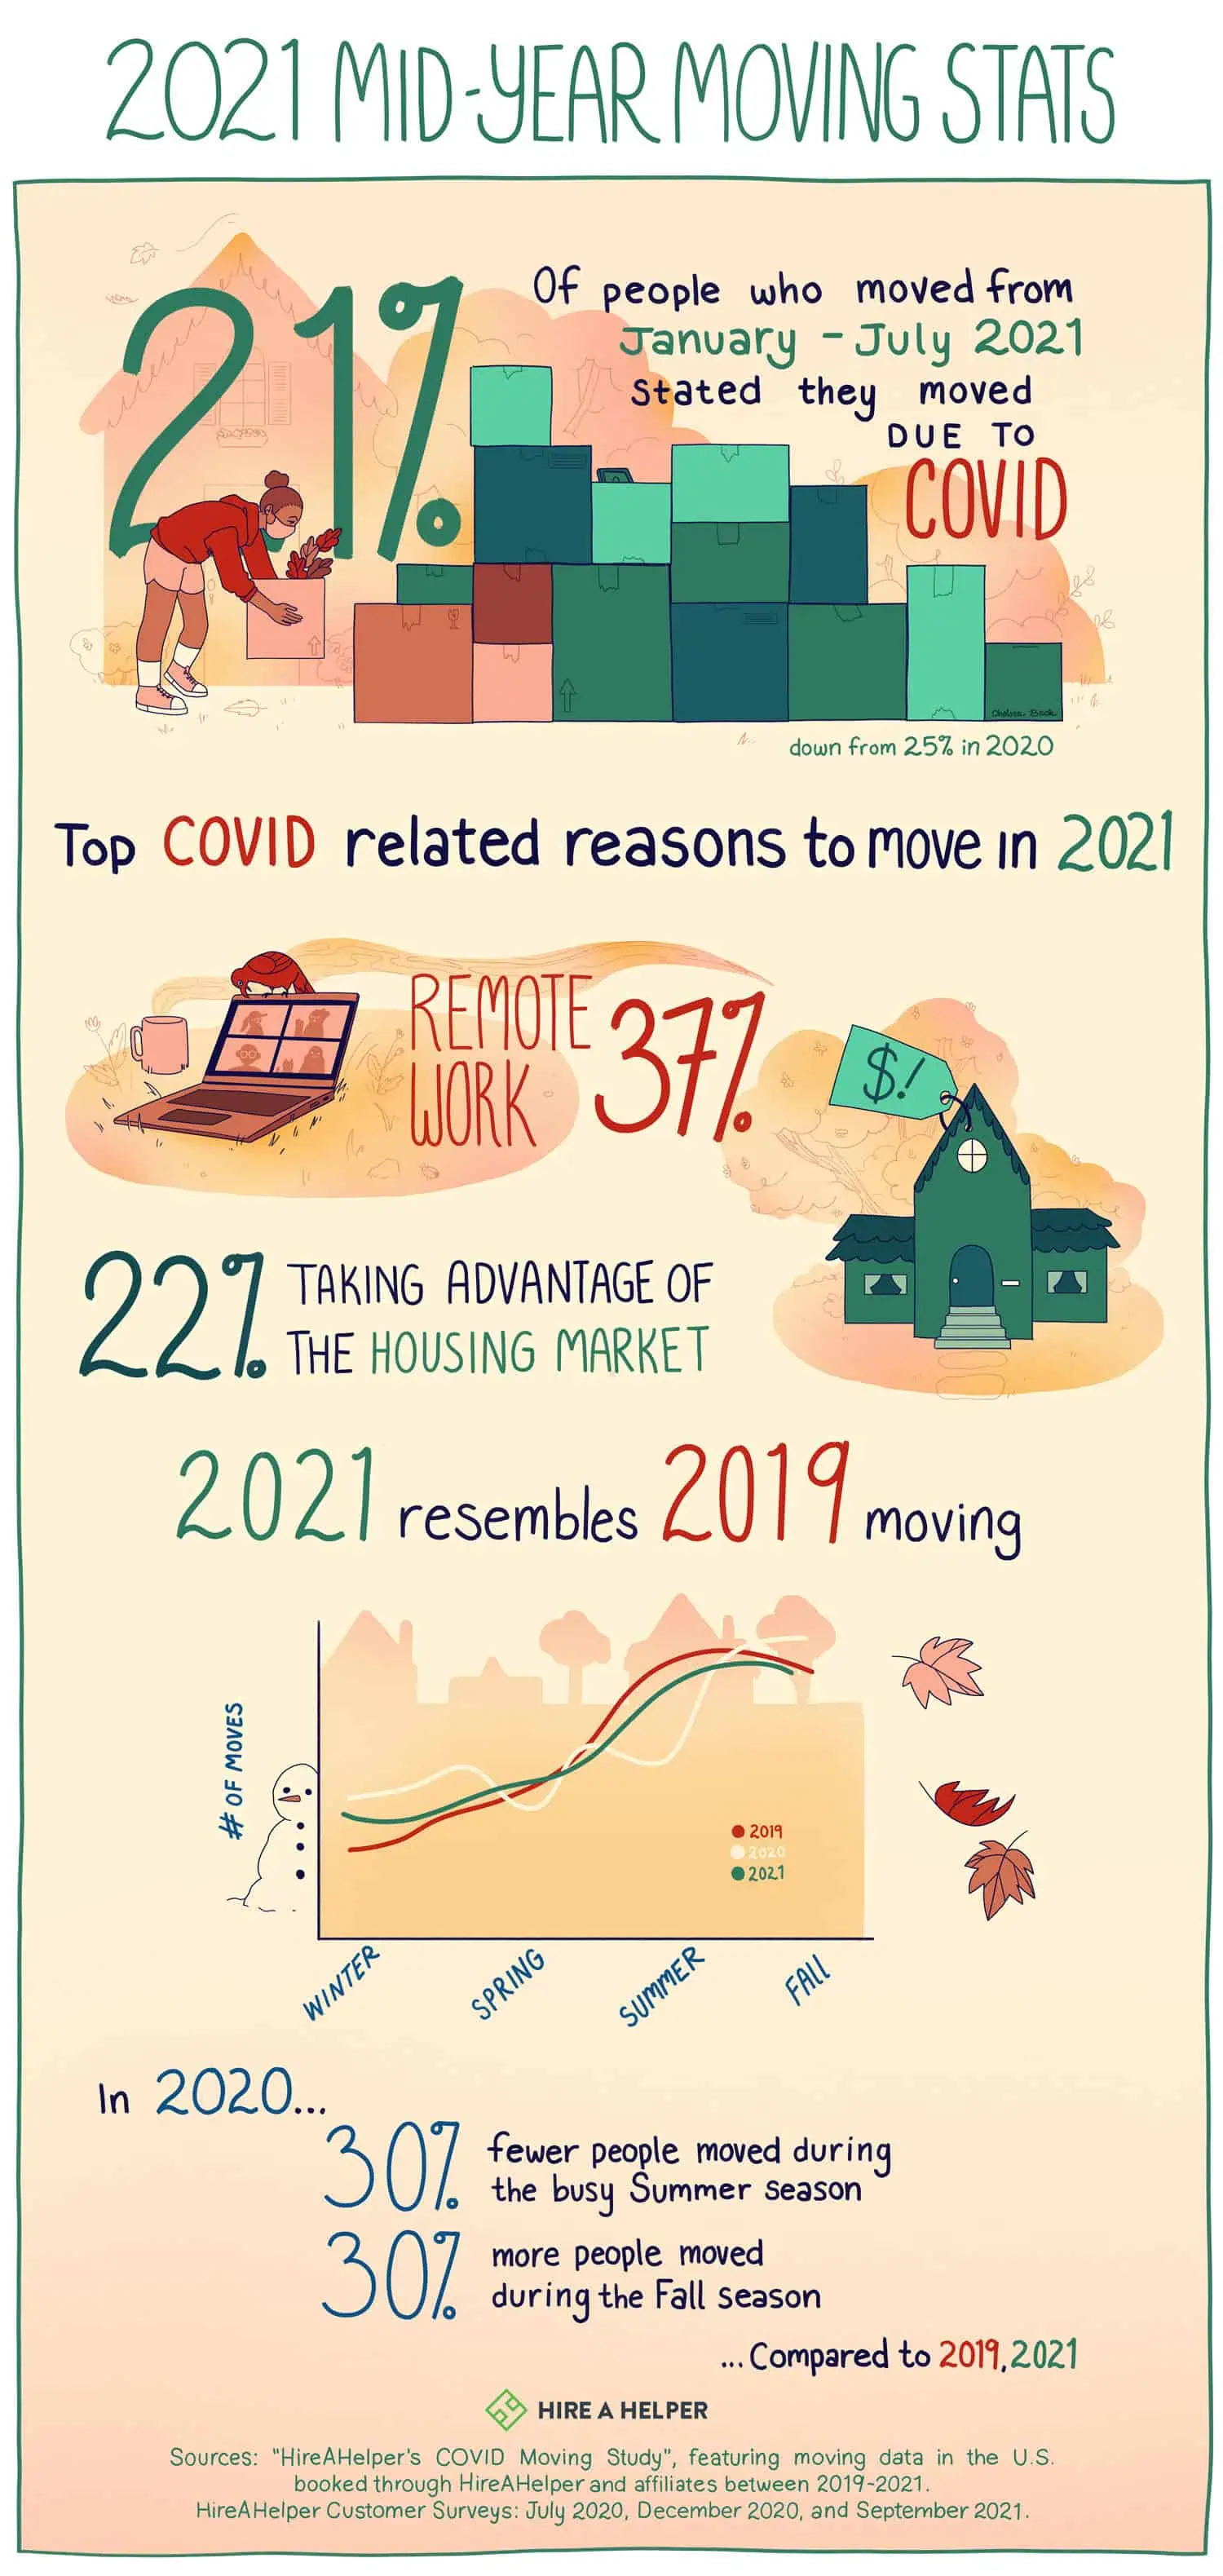
  • 21% of people who moved from January through July 2021 said they moved due to COVID-19
  • During the first three months of 2021, every third move was due to COVID-19
  • 37% of COVID-related moves were people moving due to going remote
  • One-in-five (22%) moved after selling their home in a favorable real estate market
  • Around 18% moved because they didn’t feel safe where they lived
  • 17% moved because they couldn’t afford their housing and had to relocate
  • For the first time in years, more people moved into New York City (+51%) than left it


When we looked at how Americans moved during the pandemic at the end 2020, people reported about one-in-four moves were due to COVID. Moreover, most of those surveyed who said they moved due to COVID were driven by concerns for personal health and safety, financial hardship, and the need to take care of family.

How have things changed in the world since? Well, 2021 has been an ever-shifting landscape for moving so far.

delta covidA rapid rise in vaccinations at the start of the year was followed by a dramatic drop in the number of cases, as people started seeing friends and family socially again and public life began to reopen. And yet in July, despite the 52% majority of Americans being fully vaccinated, cases and hospitalizations were on the rise again, and today, there is even talk of a fourth wave.

Meanwhile, among factors directly related to public health, employers are deciding whether to go fully remote or to ask everyone to go back to the office (or go for something in-between). Elsewhere, the real estate market continues to exceed all expectations as prices climb higher than ever and homes are selling at a record pace.

Okay, so how have these recent events affected the way Americans move? To find out, we analyzed a sample of over 57,000 related moves booked through HireAHelper.com and our partners from January through July of 2021. We also surveyed these customers to understand why Americans said they moved throughout 2021.

Defying Delta: Americans Continued to Move at 2019 Rates Despite Ongoing Pandemic

During this time in 2020, overall moving came to an almost grinding halt. Likely due to a fear of infection, many opted to move by themselves, booking activity was low, and cancellations were through the roof. 

As we found out through the data later, many moves simply ended up being postponed for later in the year when it was safer. Towards the end of 2020, the overall number of yearly moves actually evened out as the busy summer “moving season” shifted towards the end of the year.

In 2021, we have a different story on our hands. As the number of newly discovered COVID cases dropped, the number of moves grew at a slow but steady pace. Then, as national vaccinations began to pick up the pace, so did the moves. By April-May 2021, many more Americans were moving than the year previous.

This trend continued into the summer months, despite the surge of the Delta variant, otherwise known as the latest variant of the coronavirus which became the dominant strain in the U.S. in early July.

Whether due to the proliferation of the vaccines, the unwillingness to postpone moving plans any longer, or just harsh economic realities, Americans seem to be moving much more actively in 2021 so far. 

Get Help Unloading Your Rental Truck

See prices for movers by the hour—instantly.

Read real customer reviews.

Easily book your help online.


Remote Work, Real Estate, Return to Safety: Why Americans Said They Moved in 2021

As noted at the top of the article, 21% of moves made by our customers in 2021 were due to COVID-19, and more specifically the Delta variant.

That’s somewhat down from 25% at the end of last year, but still higher than the 15% of moves forced by the COVID pandemic we saw in early 2020.

Apart from being fewer in number, other things different about this year’s COVID-related moves are the reasons behind them.

In mid-2020, people who moved because of COVID claimed they did so out of financial hardship, to be closer to family, or due to feeling unsafe where they lived. By the end of 2020, the top reasons were similar: feeling unsafe, loss of job or income due to COVID, taking care of family.


“Financial hardship and concerns for safety gave way to remote work (37%) and taking advantage of the housing market by selling a home (22%) as the top COVID-related reasons to move in 2021.”


This year, however, things changed. Financial hardship and concerns for safety gave way to remote work (37%) and taking advantage of the housing market by selling a home (22%) as the top COVID-related reasons to move in 2021. 

This isn’t to say that concerns for health and safety are completely gone. Almost all COVID-related moves still happen for those very reasons, but the shift is clear. In 2020, pandemic-related moves were about sheltering in place to adapt to the new reality. In 2021, Americans seem to be making the most of the opportunities the pandemic presented despite all the hardship it brought about.

The Change of Reasons: Covid-related Reasons for Moving Throughout the Year

Sure, across seven months, many people moved to work remotely or after selling their homes in the booming real estate market. But that’s not always been the case in 2021. Let’s look at the most common COVID-related reasons for moving in 2021, over time.

Feeling unsafe due to COVID spread held at 10% of all pandemic-affected moves for five months, dipping to as low as 5% in June. But then the Delta variant happened. By July, as many as 15% of all pandemic-related moves were people concerned for their safety from the rapidly spreading infection.

Moving to work remotely is the reason that only became more common as the months went by, accounting for roughly 20% of all COVID-related moves in 2021. Selling a home peaked in May-June time, when this reason contributed to 15% of all COVID-related moves.

One reason that became less and less common as the year 2021 went on is moving due to losing jobs and income to COVID. Last year, as many as 35% of moves forced by the pandemic were down to financial hardship. In July 2021, financial hardship only accounted for 8% of stated reasons for a move.

Back to the Office? New York City Had More People Move in Than Out for the First Time in Years

We’ll leave the traditional review of where people are moving to and from for our annual report, but there was one curious finding that emerged from our analysis of moves in 2021 thus far.

According to the data, reports in the media, and figures from other companies in the moving industry, one trend always shines through; when you look at America’s biggest cities, such as New York, Chicago, Los Angeles, San Francisco, more people typically leave them than move in.

This has been true for years, but now we may have an exception on our hands. 51% more people moved to New York City than left New York City in the first seven months of 2021. 

In fairness, except for NYC, all the other major U.S. cities are showing the same trend they have in recent years—more people are leaving them than moving in. 

Whether this is a sign of an impending “big return to the office”, an indication that people started feeling safer, or a blip in the data remains to be seen. (We’ll round up all the moving trends in our annual report, likely to be published in January 2022.)

Return to Normal? Moving in 2021 Looks More Like It Did Before the Pandemic

Not only are people actively moving again, how and when they’re doing it resembles pre-pandemic patterns more than it does last year’s trends.

Take when people move, for example. In 2020, due to the spread of COVID-19, many people were forced to either cancel or postpone their move. This is why we saw 30% fewer people moving during “peak moving season” of May-July and 30% more in September-October time.

That’s not what 2021 looks like so far. If we look at when people moved this year and compare it to the last two years, we’ll see that the 2021 curve resembles 2019 a lot more than it does 2020. 

Another indication that moving in 2021 looks a lot more like 2019 than 2020 is how big the moves are again.

In 2020, likely due to many moves headed towards temporary, smaller accommodation, the size of an average move stood at 1,595 square feet, down by 282 square feet from 2019. 

But in 2021, the moves are big again—bigger than 2019 in fact. A typical move so far in 2021 was 1,793 square feet.


Based on the data, it looks like despite the surge of the Delta variant (or possibly in tandem with it), Americans moved in larger numbers in 2021 than in 2020 thus far.

As coronavirus continues to mutate and the overall vaccination pace slows, it’s impossible to predict what’s going to happen in the coming months. Whether moves will continue unimpeded or we’ll be forced to slow down and shelter-in-place again remains to be seen.

One thing we know for certain is that protecting your health and safety is still critically important when moving. If you are thinking of moving, be sure to check out our guides to moving during the pandemic and when states reopen to make sure your move goes safely, as well as smoothly. 

2021 Mid-year Moving Stats Infographic

covid infographic

Sources and Methodology
HireAHelper’s COVID Moving Study analyzed moving data in the U.S. booked through our online platform in 2021. Year-on-year comparisons of moving activity between 2021, 2020, and 2019 cover the period of January 1st through July 31st 2021.
Unless otherwise stated, all percentages, breakdowns, and summary statistics are derived from the data captured by HireAHelper.com and its partners.
Data on reasons why Americans moved came from HireAHelper customer surveys conducted in July 2020, December 2020, and September 2021.
Illustrations by Chelsea Beck

Every Major Moving Report of 2017 Analyzed: Where Is Everybody Going?

Author:

Publish Date:

Last Modified Date:

Category: Moving Industry News

Tags: Tags: , , , , , , , , , , , , , , , , , , , , , , , , ,

Migration reports are out in full force, including the famous United Van Lines yearly report.

But while United handles more moves annually than any other mover network in the country, their numbers are not definitive across the industry board.

North American, Atlas and Allied all see slightly – and in some cases, wildly – different results in their migration study results. Not a surprise, because as a Full Service move provider, United handles a somewhat different clientele compared to companies like ABF, U-Haul and PODS – companies whose numbers might look a lot different. Then there’s that little thing called the Census.

Yep, the state-to-state migration numbers for 2017 are out – and folks, we have new inbound state championsHere are the results:

United Van Lines

Vermont Takes United 2017 Inbound Crown

In 2015 they came in at third on the inbound rankings. In 2016 they inched their way up to number two. Now, this tiny state known mainly for skiing and maple syrup has captured the coveted top inbound spot on United’s 2017 National Movers Study.

Yes, the champagne is indeed flowing like syrup in Stowe, Killington and Montpelier as Vermont looks back on a year that saw a whopping 68% of their interstate moves coming in. 

Reasons

According to United’s survey, “family” was the most common reason respondents gave for relocating to the Green Mountain State. Retirement, lifestyle and job also figured fairly evenly into the equation.

On the other hand, a full 75% of people moving out of state gave employment as their reason. This helps explain why half of all outbounders fell into the Under-35 age category – and another 25% were between 35 and 45 – while 40% of those moving into the state were 65 or older.

Those mountains may be green, but with those unemployment numbers, it looks like the valleys are starting to turn gray.

But before we start replacing all those ski lifts with wheelchair-friendly escalators, let’s take a step back and look a little closer at where the stats behind Vermont’s inbound crown come from. Keep in mind we don’t know how many moves Vermont actually saw by their report. (68% can be broken down to 17 inbound moves and 8 outbound moves – which hardly amounts to a mass migration to this land of wooden bridges and Bernie Sanders.)

Inbound:

1. Vermont
2. Oregon
3. Idaho
4. Nevada
5. South Dakota
6. Washington
7. South Carolina
8. North Carolina
9. Colorado
10. Alabama

This past year saw some familiar names on United’s Top Ten Inbound States list. Oregon, Nevada and North Carolina are all there, as they have been every year since 2011. Washington, Idaho, South Dakota, South Carolina and Arizona are also back after making 2016’s inbound list. Newcomers include Alabama and Colorado. Meanwhile, Florida has dropped off the inbound list after a strong three-year run.

This past year’s top inbound states are also fairly spread out around the country. The same cannot be said about United’s outbound states.

Outbound:

1. Illinois
2. New Jersey
3. New York
4. Connecticut
5. Kansas
6. Massachusetts
7. Ohio
8. Kentucky
9. Utah
10. Wisconsin

As with the previous few years, the major exodus seems to be coming out of the Northeast and the Midwest, with Utah adding a little “outbound yellow” to the otherwise blue western region on United’s interactive migration map.

Perennial outbound states New York, New Jersey, Connecticut and Illinois have been the most unfortunate ones; we’d have to go back to 2010 to see any of them as balanced. (New York and Connecticut were both spared the shame that year).

North American Moving Services

northamerican.com

Arizona Takes North Americans 2017 Inbound Crown

North American’s inbound champ is Arizona, with 67% of their interstate moves coming into the Grand Canyon State. Other top inbounders not on United’s list include Tennessee, Florida, Georgia and Texas – all south and southeast states. (Those North American drivers must really love the south.)

Inbound:

  1. Arizona
  2. Idaho
  3. North Carolina
  4. South Carolina
  5. Tennessee

Outbound:

  1. Illinois
  2. Connecticut
  3. New Jersey
  4. California
  5. Michigan

Like United, North American has Illinois, New Jersey and Connecticut at the top of their outbound list (with New York a notable #8). But the rest of their top outbounders – California, Michigan, Pennsylvania, Minnesota and Maryland (#4-8 on the map) aren’t even on United’s radar.

Interestingly, North American’s #10 outbounder is Washington, which ranks #6 on United’s inbound list.

In accounting for these discrepancies, it is worth noting what North American says of their report’s methodology:

We define the top inbound and outbound states as those that have the highest proportion of moves where the absolute value difference of inbound and outbound moves is greater than or equal to 400. This weeds out states that had a small number of moves but would have a high ratio of inbound/outbound moves.”

This may explain why United’s 2017 champ Vermont and #5 South Dakota (United’s #1 in 2016 by the way) aren’t anywhere on North American’s Top Ten.

Atlas Van Lines

atlasvanlines.com

Washington Takes Atlas 2017 Inbound Crown

Atlas Van Lines offers some relative surprises too. Idaho, Washington and Nevada as their top three inbounders may not raise any eyebrows. But Alaska, Maine and New Hampshire at #5, #6 and #10? Oregon is a familiar name, but seeing them at #8 seems in contrast to their recent United Van Lines inbound championships.

Atlas’s top outbounder, meanwhile, is Illinois (same as both United and North American – those Fighting Illini have a real stranglehold on that top spot!). And their #2, West Virginia, was a strong outbounder for United for six years straight before balancing out in 2017.

But Nebraska at #3? Nebraska has been balanced for United since 2001! And #4 outbounder South Dakota has been an inbound darling for United the past three years.

Rounding out the Atlas top outbound list are Hawaii, Indiana, Delaware and Louisiana, all of them somewhat surprising since three of them have spent the last ten years on United’s “balanced” register. Only Indiana has managed to make a blip on United’s outbound radar in that time frame.

Inbound:

  1. Idaho
  2. Washington
  3. Nevada
  4. Tennessee
  5. Alaska
  6. Maine
  7. North Carolina
  8. Oregon
  9. Alabama
  10. New Hampshire

Outbound:

  1. Illinois
  2. West Virginia
  3. Nebraska
  4. South Dakota
  5. Hawaii
  6. Indiana
  7. Delaware
  8. New York
  9. Louisiana
  10. Kansas

In contrast to the percentages United and North American provide, Atlas gives actual numbers of inbound and outbound moves for each state. Here we see that Vermont has seen just a fraction of the moves so many other states see, so it’s easy to imagine why they wouldn’t have made it onto North American’s list. (Meanwhile, once again, Canada’s Yukon Territory has seen zero moves. We’ll blame it on the roads.)

Allied Van Lines

allied.com

Florida Takes Allied 2017 Inbound Crown

Allied Van Lines keeps it all very short and sweet. They report only their top fives:

Inbound:

  1. Florida
  2. Arizona
  3. North Carolina
  4. South Carolina
  5. Texas

Outbound:

  1. California
  2. Illinois
  3. Pennsylvania
  4. New Jersey
  5. Michigan

Based on this limited report, we’re able to come to at least one solid conclusion: Allied’s drivers love moving people south even more than North American’s do.

U-Haul

Texas Takes U-Haul 2017 Inbound Crown

Because news outlets predominately focus on Full Service van lines, it can easily be argued this eliminates an entire sector of the migrating public. (In fact, Full Service van lines actually conduct less than half of all moves performed in the US every year.)

Do U-Haul’s numbers reflect what the van lines suggest are moving trends?

Nope.

Inbound:

  1. Texas
  2. Florida
  3. Arkansas
  4. South Carolina
  5. Tennessee
  6. Washington
  7. North Carolina
  8. Connecticut
  9. Colorado
  10. Vermont

Outbound:

  1. California
  2. Illinois
  3. Pennsylvania
  4. Michigan
  5. Massachusetts
  6. New Jersey
  7. New York
  8. Arizona
  9. Maryland
  10. Georgia

Texas tops U-Haul’s 2017 Growth States list. This shouldn’t come as a huge surprise, as Texas has fared well recently in the inbound-outbound game. In 2017 their inbound percentages with United, North American and Atlas were 54, 53 and 53, while Allied put Texas down as their fifth biggest inbound state.

Oddly, Texas won U-Haul’s Growth State crown by bringing in – get this – a whopping 50.3% of all one-way truck rental traffic crossing Texas’s borders. That’s right. Fifty. Point. Three.

This hardly lends a whole lot more understanding to the migration trends we’re trying to dissect. But here we are, so let’s keep moving.

U-Haul rounds out its top five Growth States with Florida, Arkansas, South Carolina and Tennessee. Yes, Arkansas – which has been balanced on United’s report 37 of the last 40 years. Then again, Arkansas remained balanced in 2017 on United’s ledger with a 54% outbound rate, so that they are U-Haul’s #3 Growth State is rather surprising no matter how minuscule their positive U-Haul balance might have been.

And who comes in at #8 on U-Haul’s list? That big loser with United and North American (but not with Atlas), Connecticut.

On the flip side, U-Haul has Colorado at #9 – exactly where United and North American have them.

United States Census Bureau

Idaho Takes United States Census Bureau 2017 Inbound Crown

Yes, the Bureau has all the moving numbers we could possibly want. So many, in fact, that it could take until next January to weed through them all.

But thanks to Business Insider we don’t have to.

In this piece with the strangely long title: While the Bureau considers “a variety of components” in determining what’s happening among the more than 325 million people who make up the US population, Business Insider brings us what we need: domestic migration.

Here we see the net population gain or loss for each state for 2017. Births, deaths and international immigration are not counted; this is simply and strictly an account of how many people moved into or out of each state. (Again, not moves, but individual people.)

Inbound:

  1. Idaho
  2. Nevada
  3. South Carolina
  4. Oregon
  5. Arizona
  6. Washington
  7. Montana
  8. Florida
  9. Colorado
  10. North Carolina

And in this, the winner is Idaho, with a net domestic migration gain of 14.6 people per 1,000 residents. In second place comes Nevada, with South Carolina, Oregon and Arizona rounding out the top five. The second half of the big ten winners are Washington, Montana, Florida, Colorado and North Carolina.

These results actually mirror the van lines’ findings to a striking degree. Only Arizona, Montana and Florida don’t show up in United’s top ten. Seven of the Census top ten are also on North American’s top ten. Unbelievably, Colorado is #9 on all three lists.

As for the Net Domestic Migration losers? Yes, Illinois is up there, but at #5, maybe this is the survey they should be talking about in Chicago.

Outbound:

  1. Wyoming
  2. Alaska
  3. New York
  4. Hawaii
  5. Illinois
  6. North Dakota
  7. New Jersey
  8. Connecticut
  9. Louisiana
  10. West Virginia

The big loser in the 2017 migration tournament is Wyoming, a surprise since the Equality State doesn’t show up on any van line outbound lists – or inbound for that matter. United had them at 53% inbound for 2017. North American had them at 54% in. Only Atlas has them as outbound – based on a grand total of 330 moves.

The Bureau’s next three biggest net migration losers are Alaska, New York and Hawaii. Alaska and Hawaii, neither of which show up anywhere for United or North American, are Atlas’s #5 inbound and #5 outbound, respectively. North Dakota, New Jersey, Connecticut, Louisiana and West Virginia complete the Bureau’s top ten.

Again, while there are outbound wild cards, we still see some consistency between the Bureau and the van lines. Atlas and the Bureau actually have seven migration losers in common between their top tens. Looking at the US Census Bureau’s Net Domestic Migration map we can clearly see the winners clustered in the south and west with the losers dominating the northeast and midwest.

What’s The Takeaway?

Remember, the numbers put together by each of the van lines represent the migration trends among the customers they’ve served. Van lines count moves, the Bureau counts people.

This may not account for the reason United’s inbound champion Vermont is somehow a net loser according to the Census Bureau’s numbers, but it does suggest that, despite the discrepancies, the van lines and the Census Bureau can give a decent overall on what is going on out there.

But in the cases where data remains too contradictory to be meaningful, evaluating regions rather than individual states might give us a slightly more reliable picture of the migration trends playing out across the US. At the end of the day, we are only looking at a mere slice of the American migratory pie.

There’s More Realistic Data Out There

We need another, more encompassing way to look at where America is moving to and from.

DIY Moves and Hybrid Moves (besides U-Haul), which by far and away are the more common ways to move, are sorely misrepresented. When you move, do you routinely call up $2,000+ movers? Have you ever saved money by having your friends move you? What are these Full Service reports actually reflecting?

That’s something to keep in mind when the local news sounds off on “moving trends” based off a single Full Service Moving company’s report. 

×

I'm Moving

Moving? Thinking about moving? Whether your move is off in the distance or you already have one foot out the door, you'll learn about everything you should expect through our useful how-to's, cool articles and much more. It's all specially curated for you in our "I'm Moving" section.
Explore
×

I'm a Mover

For rookies or veterans alike, our "I'm a Mover" section is filled with extensive industry news, crucial protips and in-depth guides written by industry professionals. Sharing our decade of moving knowledge is just one way we help keep our professional movers at the top of their game.
Explore