Moving Permits 101: How To Get a Parking Permit for Moving

Author:

Publish Date:

Last Modified Date:

Category: Movehacks, Moving Advice, Moving Checklists & Planning

Tags: Tags: , , , , , , , , , , , , , , , , , ,

If you live in one of the bigger U.S. cities, chances are you’re well acquainted with the inconvenience of clogged streets caused by double-parked vehicles. And you’re also familiar with what a pain it can be to park your car near your home — let alone a moving truck! Thankfully, some of these cities offer temporary single-use parking permits for moving, AKA moving permits.

But do you actually need a parking permit for your upcoming move? And if you do, how on earth do you get one? The subject of parking permits is a complex one, and every city has its own way of doing things, but this article will help give you an overview of what to expect.


What Is a Parking Permit?

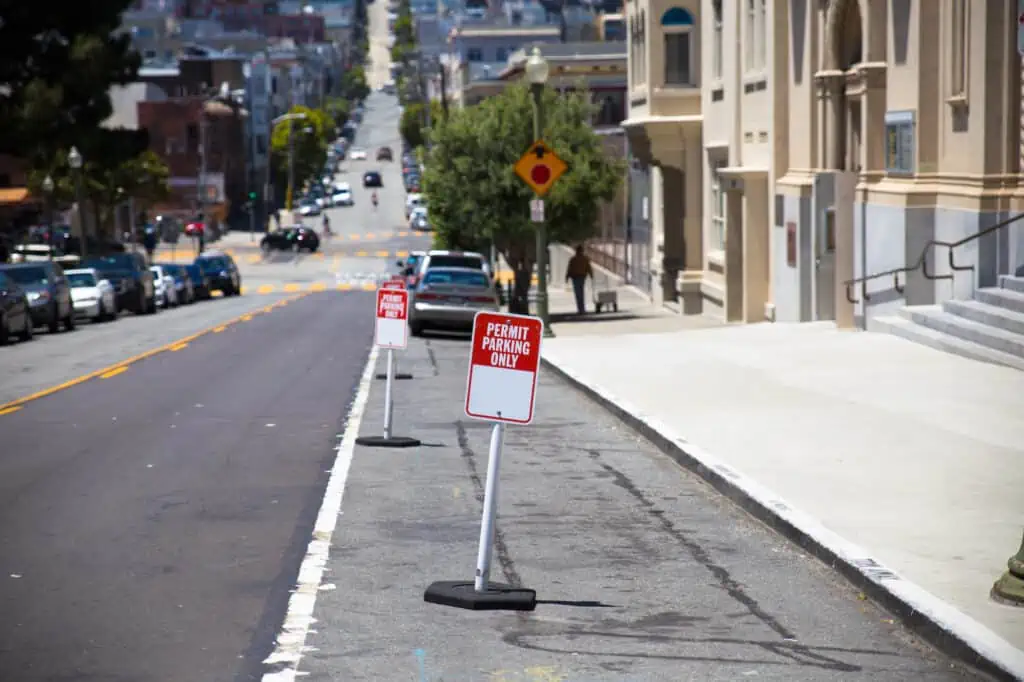
parking permit signs set for a moving truck on a street

A parking permit typically grants permission to park a specified vehicle for a day or two on a future date. Cities typically charge for these permits, and they must be applied for at least three to ten days prior to the project start date. The fees can range from $5 to $400. 

What you call a parking permit can differ from city to city, too. Some examples of names include:

  • Obstruction permit
  • Street use permit
  • Encroachment permit
  • Occupancy permit

But a city will never call it a “moving permit”, even if you’re using your parking permit for moving. 

A parking permit also usually grants the ability to enforce parking at the specified location, which is key to ensuring the spot stays open for your moving truck. This is why parking permits almost always come with official cardboard signs that say NO PARKING or TOW ZONE.  If vehicles ignore the signs on the date(s) of the permit, the requester can call the city to have the violating vehicles towed. 

These signs must be posted at the location visible to traffic about three days prior to the job start date. Some cities handle the posting themselves, but most require the requester to do the posting.

What’s the benefit of a parking permit for moving?

movers unloading boxes from a moving truck that's parked on a residential street

For anyone who lives in a congested city, the benefits are obvious. To parallel park a moving truck, you need about 40 feet of space, which is two consecutive parking spaces. For those of us who live in a city like Boston, Philadelphia, Seattle, or San Francisco, we know that finding two consecutive parking spaces on your street is practically impossible, let alone finding two open spaces in front of your home on the exact day you need them. 

When you’re moving a home’s worth of furniture and other heavy items, you want your moving truck to be as close to the door as possible. Imagine lugging your couch for three city blocks. No fun!


“…[N]ot all cities issue parking permits for moves, most notably New York City. You should double-check that the one you’re moving to does.”


“But I’m hiring a mover,” you say. “They’re doing all the heavy lifting for me, so why should I worry about it?”

Well, first of all, while movers appear to be superhuman gods, they get tired too. Secondly, time is money. The longer it takes for the job to be complete, the more your movers will charge you. Not only that, but most movers charge “long carry” fees, which can add up over time.

I know what you’re going to say next: “Can’t we just double-park and throw on the hazards? I see trucks doing that all the time.”

Sure you can — if you don’t mind paying exorbitant fees for multiple parking tickets. When truck drivers double park, it’s often for a quick in-and-out delivery. Moving can take hours, sometimes days, which will result in tickets, towing, or worse. Plus, it’s not very neighborly to block traffic if you live on a narrow street. You really don’t want your first or last impression to be the person who made driving difficult because they parked somewhere they shouldn’t have. 

See prices for local moving labor. Read real customer reviews. Easily book your help online.

Parking Permits Process 

Parking policies are different in every city, but the basic procedure for most cities is:

  1. Permit gets applied for
  2. City approves permit
  3. City charges for total
  4. City issues and provides permit document
  5. City issues and provides official NO PARKING or TOW ZONE signs
  6. Signs get posted at the location prior to the start date
  7. Moving crew calls for enforcement on move day (if needed)
  8. Violating vehicles get towed to provide space for the job (if needed)

But beyond these basics, every city is an entirely different beast. Here’s a list of some of the details that can vary from city to city:

  • Permit name
  • Department that issues the permit application procedure 
  • Documents required
  • Permit fees
  • Lead time (how many days in advance you need to secure your permit)
  • Sign posting lead time (how many days in advance you need to post signage)
  • Fees
  • Payment method
  • Enforcement
  • Who posts the signs (whether it’s the city or you)
  • Metered versus residential parking
  • Sign verification
  • Right-of-way policies
  • Street cleaning
  • Maximum and minimum days allowed for length of permit 
  • Differences in neighborhoods

And the list goes on. Just to give you an idea of how much work this entails, let’s take two cities as examples:

Washington, DC Moving Permits

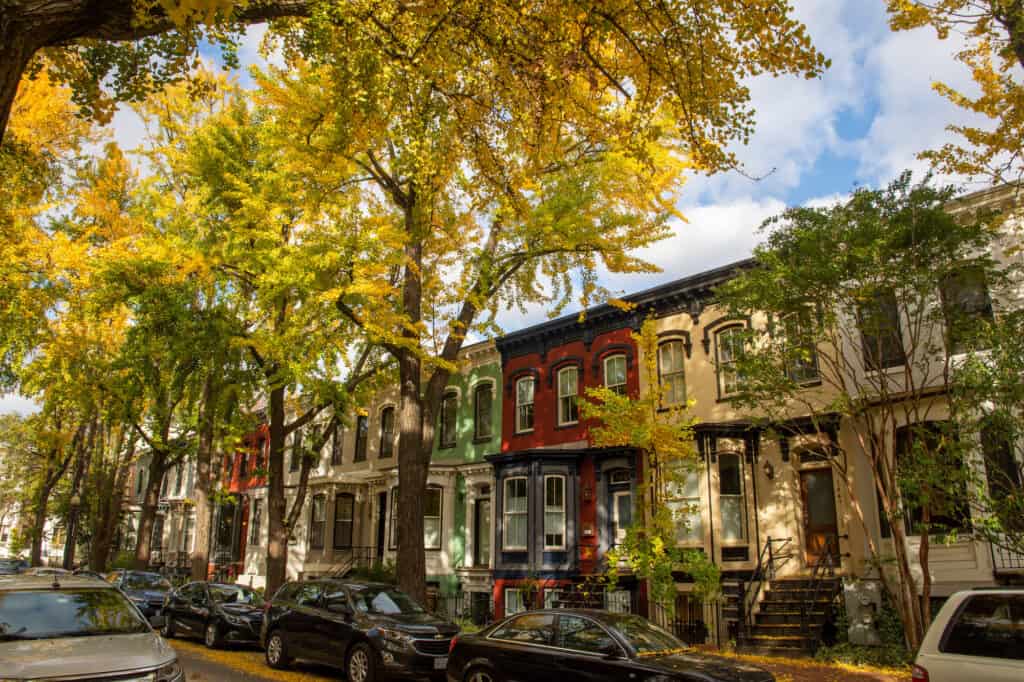
a Washington DC neighborhood in the fall with colorful home fronts and a street filled with parked cars

  • Lead time: 4 days
  • Permit name: Public Space Occupancy/ Parking Permit
  • Issued by: Transportation department  

If you’re moving in Washington, D.C., you will likely need a parking permit for your move, as parking is very tight. As you know from above, the typical moving vehicle requires 40 feet of on-street parking (two consecutive parking spaces). Securing these spaces in front of your address on the date of the move is almost impossible unless you go through the process of obtaining a city-issued moving vehicle occupancy permit. You also have to retrieve and post city official TOW ZONE signs and verify those signs 72 hours prior to the start date.

City of Boston Moving Permits

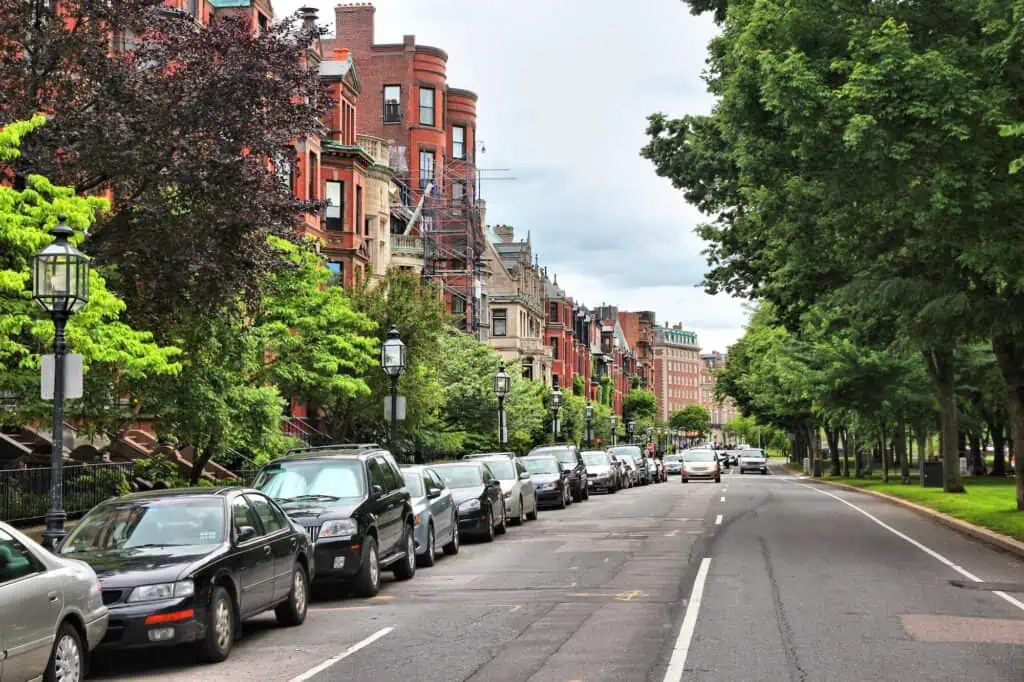
a neighborhood in Boston with brick homes and the street lined on one side with parked cars

  • Lead time: 4 to 6 days
  • Permit name: Moving Permit  
  • Issued by: Parking Clerk

If you’re planning on using a moving truck or moving container in Boston, you’ll most likely need a parking permit as well. Boston is a very congested city, and while this is part of its charm, it makes finding two open, consecutive parking spaces near your address on the date of your move practically impossible unless you’ve secured a permit.

Unfortunately, the city of Boston doesn’t make this easy. The best way to get a parking permit in Boston is to visit City Hall about one week in advance, wait in line at the permit counter on the second floor, and apply and pay for the permit. Then, you have to obtain the TOW ZONE signs, and post the signs on trees or poles in front of the address three days prior to the start date.

Do I Need a Moving Permit?

a woman looks at a laptop while surrounded by moving boxes

Wondering whether or not you’ll need a parking permit for moving day? The first step is to consider your current location, as well as your destination, and come up with a plan for parking your moving truck. Here are a few common scenarios: 

  • You have a driveway spacious enough to park a large truck: Good for you! But keep in mind some moving companies avoid parking on private property to avoid damage claims, so you’ll want to check with your mover ahead of time to make sure this is an option. If you can use your driveway, then there’s no need for a permit.
  • You live in a condo or a larger building: Check with building management to see if your building has a loading dock or solution for your moving vehicle, as you’ll likely need to reserve the loading dock and/or elevator in advance.
  • No driveway or loading dock is available: This means you may need to park your moving truck on the street. You’ll need to find the nearest legal street parking, which is hopefully directly in front of the building. If this is usually open and accessible, you probably don’t need a parking permit. If spots can be hard to come by here, it’s probably best to secure a permit.
  • You live in a crowded neighborhood where an open parking space is occasionally limited: In this case, it might be a good idea to get a moving permit. Your neighbors will be much more tolerant of interruptions or obstacles if you go through the proper channels and post signs before your moving day

However, not all cities issue parking permits for moves, most notably New York City. You should double-check that the one you’re moving to does.

See prices for local moving labor. Read real customer reviews. Easily book your help online.

How To Get a Moving Permit

This can be a challenge, as cities don’t always make it straightforward. You first need to find out if the city offers this type of permit and then how to obtain it. 

Each city’s process is different. Some cities will make you physically visit City Hall and wait in line at a counter. Most cities will make you post NO PARKING signs three days prior to the start date, which isn’t always an option for people moving from out of town.


“A parking permit also usually grants the ability to enforce parking at the specified location, which is key to ensuring the spot stays open for your moving truck.”


For this reason, many people opt to hire a third-party company like Permit Puller to help them secure a permit. Since parking permits are their area of expertise, a company like this will know all the ins and outs of moving permits for your particular city. They’ll also do all the leg work for you, including posting the NO PARKING signs at your address the required number of days before moving day.

If you decide to go the DIY route, just make sure to contact your city well ahead of your move. The application process is rarely quick or simple and can involve multiple departments, cobbled-together websites, long lines, and unfriendly bureaucrats. Even so, it’s well worth having a parking permit on moving day to ensure your move goes as smoothly as possible.

2023 Study: Where, How and Why Are Americans Moving This Year?

Author:

Publish Date:

Last Modified Date:

Category: Local Moving

Tags: Tags: , , , , , , , , , , , , , , , , , , , , , , ,

Key Findings

  • More than half (52%) of all moves in America take place in the summer
  • Our survey findings suggest 40% plan on moving at some point this year
  • ‘Family’ (30%) and ‘Wanting More Space’ (25%) are the top reasons for moving this year
  • A total of 38% are moving for financial reasons, such as inflation, cost of living, and housing unaffordability
  • Climate change is a factor mentioned by 15% of Americans planning to move this year
  • 40% of those moving intend to stay within their city, but 18% are set on moving to a different state
  • More than half (55%) of those not moving this year would move if they had the means


Every year, millions of Americans move, and over half (52%) of those moves take place during what we in the moving business call “moving season” — otherwise known as the summer months of May through August.

So what does the moving season hold for us this year? To get a sense of how many Americans intend to move, when they’re going to move, and what drives their moving decisions, HireAHelper conducted a nationally representative survey of 2,000 adults in the U.S. earlier this month.


“The state most people have their sights on is California, where 11% would move if finances weren’t an issue.”


38% of Americans we surveyed intend to move at some point in 2023, collectively citing “Family“, “Looking for More Space” and “Wanting To Save Money” as the top reasons. A further 35% would move if they could, but find themselves struggling to afford housing where they want to live, or are struggling to afford the move itself.

Let’s delve into the findings and see how Americans look ahead to the 2023 moving season.


Moves in the Making: Four in Ten Americans Plan To Move in 2023

an illustration of someone taping a box. In the corner it's labeled fragileAs we noted earlier, nearly four in ten (40%) of our survey respondents said they are planning to move at some point this year. 

Moving intent is highest among the younger generation, as almost half (49%) of Gen Z respondents reported a planned move for sometime in 2023. And while this intent is still strong with Millennials (42%), it gradually fades with age, and dropping to a reported 27% for Baby Boomers.

Interestingly enough, Parents (41%) are more likely to be planning a move in 2023 than Non-Parents (36%). That said, that only applied to families with one or two kids. For families with three or more children, the percentage of those staying put exceeds the percentage of prospective movers.

Renters (46%) are more likely to be on the move than Homeowners (30%). However, only 25% of renters who are moving expect to own their next home, as 59% of renters reported moving to another rental.

Where are people leaving?

an illustration of white plates and cups being wrapped in brown packing paper. A currently empty cardboard box sits nearbyAmong people living in America’s biggest metropolitan areas, the intent to move is highest in Washington, D.C. (72%) and Los Angeles, CA (55%). There, the majority of residents we surveyed reported having plans to move at some point this year.

In San Francisco, CA (47%), New York, NY (46%), Philadelphia, PA (46%), and Houston, TX (45%), the share of people who reported intent to move this year fell just below half.

Conversely, within the metros of Charlotte, NC (16%), Orlando, FL (32%), and Chicago, IL (32%), the moving intent is the lowest among all metros with a sufficient number of respondents.

At the state level, New Jersey residents seem most keen to move (56%), whereas those in North Carolina (24%) are least likely to relocate in 2023.


Family, Square Footage and Finances: Top Reasons Why Americans Are Moving in 2023

The number one reason for those intending to move this year was reasons related to “Family” (30%), (such as “Being Closer to Family Members,”) with “Wanting More Space or a Bigger Home” (~25%) being the second most popular choice.


“Those who do plan on hiring some help for their move are looking to spend an average of $675…[and those] who expect to move without hired help are looking to keep it at an average of $312.”


However, if we look at the financial reasons, we’ll find that many Americans are moving either because of  “Foreclosure/Eviction” (7.5%), “Can’t Afford (Their) Current Housing” (10.7%), “(Moving Somewhere With) A Lower Cost of Living” (15.3%), or “Inflation” (17.2%).

If we add up all the respondents that said at least one of these financial reasons applies to them, the total share of Americans who intended to move due to financial pressures rose to 38%.

an illustration of a canvas wrapped in bubble wrap. it's stood on top of other packed boxes. Granted, the higher rates of inflation from 2022 seem to have leveled out, but our findings suggest that financial pressures continue to compel a significant number of Americans to relocate.

The financial reasons above were mentioned at the following rates by these demographics:

  • Families with children (40%) compared to childless households (37%)
  • People of color (44%) compared to white Americans (36%)
  • Renters (41%) compared to homeowners (35%)

Other popular reasons for moving in 2023 include “New Job” (16.2%), which, in fact, is more popular than moving due to “(Becoming) Unemployed” (9.8%).

Curiously, and unfortunately, more people are moving due to an “End of a Relationship/Divorce” (10.3%) compared to those moving due to a “New Relationship or Got Married” (7.1%).

an illustration of boxes being moved with a dollyOne significant reason that’s beginning to factor into the moving plans of Americans is “Climate Change” (14.9%), which is in fact distinct from “Want Nicer Weather” (10.4%).
According to estimates based on U.S. Census Bureau data, climate change affects some 20,000 moves per year, with experts suggesting that figure is set to increase.


Getting Practical: Planned Moving Distance and Estimated Cost

Based on our survey responses, 40% of people who are planning to move in 2023 are staying within the same city, while 33% intend to leave their current city, yet still stay within the same state.

Impressively, 18% of respondents intend to move to a different state. Specifically among those respondents, their reasons given were for “Better Weather” (38%), a “New Job” (34%), “Being Closer to Family” (21%), and “Seeking a Lower Cost of Living” (21%).

Thinking about the cost of their move, 44% intend to spend between $100 and $500 on moving, with an overall average being slightly higher at $530. This estimate includes buying moving boxes, potentially renting a truck, maybe hiring movers, etc.

Needless to say, not all Americans who plan on moving intend to hire movers, but 52% of them do, while 48% either intend to execute the move themselves or haven’t decided yet.

Those who do plan on hiring some help for their move are looking to spend an average of $675 between boxes, truck rentals, and movers. Those who expect to move without hired help are looking to keep it at an average of $312. (This figure is in line with nationwide averages of moving costs.)

See prices for local moving labor. Read real customer reviews. Easily book your help online.


Would If I Could: Common Barriers Preventing Americans from Moving

Quite a few Americans are planning to move this year, and the number could have been even higher if it weren’t for certain factors keeping people from moving.

Of those respondents that aren’t moving this year or aren’t sure yet, 55% would move if they had the means and opportunity. The main reason they can’t move? They can’t afford it. People claimed they “Can’t Afford To Move” (58%) or they “Can’t Afford Housing Where (They) Want To Live” (38%).

But it’s not just the financial worries that keep Americans from moving. About a quarter of respondents in our survey who’d move if they could selected “Would Be Too Far Away From (Their) Family” (24%), “Worried About Making a Big Change” (25%) or “Worried It May Not Work Out” (27%), respectively.

Perhaps these concerns, as well as the general decline in the percentage of Americans moving partially explains why, our study found that, on average, Americans now move an average of eight times in their lifetime, down from a 2007 estimate of 11.7 times.


Dream Destinations: Where Would Americans Move if Anything Was Possible

One question we asked in our survey was about the state Americans would move to if money was no object. 

The state most people have their sights on is California, where 11% would move if finances weren’t an issue. Notably, Hawaii and Florida were the dream destinations for 9% of Americans, while New York and Colorado were the top choices for an additional 5% of respondents. 

Texas — a state that’s recently been a popular destination for corporate moves — would also be the go-to place to be for 4% of respondents.

A surprising 4% would leave the United States altogether if they could, but as many as 9% of our respondents would not choose to leave their state, even if money was no object.


Sources and Methodology
All data, unless otherwise stated, have been derived from the findings of the survey HireAHelper ran via Pollfish in May 2023. The survey used a nationally representative sample of 2,000 adults (18+) living in the United States.
Survey results were weighted by age, gender, and income using data extracted from the American Community Survey’s five-year data, collected from ~120,000 households.

Illustrations by Nero Hamaoui

2021 Study: Renting Versus Buying, and How Both Are Impacting You

Author:

Publish Date:

Last Modified Date:

Category: Buying & Selling a Home, Money Saving

Tags: Tags: , , , , , , , , , , , , , , , , , , , , , , , , , ,

Key Findings

  • The average rent across the United States is $1,050 a month
  • The average mortgage payment in the U.S. is $992/month 
  • At $2,600/month on average, Sunnyvale, CA has the highest rent in the country
  • Gadsen, AL has the lowest rent in the U.S. at $430/month on average
  • Mortgage repayments are highest in and around Washington, D.C., at more than $2,000/month on average
  • Property taxes, utilities, and insurance add an average of $563 to the cost of owning a home 
  • Homeowners tend to make 90% more than renters ($98,700 versus $51,700, on average)
  • Renters spend an average of 32% of their disposable income on housing, while homeowners spend an average of 20%
  • In 333 out of 335 cities studied, homeowners spend less of their income on accommodation than renters


It’s a question at the heart of many debates and countless articles: Is it better to buy (if you can afford it) or to rent (if you can’t)? Which is more financially beneficial? Which is actually more affordable, and why?

One way to think about this debate is to take the average home price in each state, then estimate your repayment based on some assumptions (e.g., 20% down payment, 3% interest over 30 years, etc.), then finally, compare that number to average rent prices.

But that comparison alone doesn’t tell us the true value of renting.

What does? We looked at 335 of the biggest cities and metropolitan areas in the United States and broke down how rent levels compare to mortgage rates, how they stack up against typical incomes in each of these areas, and more.

$400 in Alabama, $2,500 in California: How American Cities Compare on Rent

The average cost of rent across the country is $1,050 a month. Cities where rent is nearest the nationwide average are Modesto, CA ($1,047), Iowa City, IA ($1,057), and Houston, TX ($1,058).

(Note: Most of the housing data in this article come from the U.S. Census American Community Survey.) 

Among the 335 major metropolitan areas we profiled, where is rent cheapest? That would be Gadsden, AL, where typical rent was around $400 per month. Among areas with the lowest rent in the country are towns in Missouri and North Carolina

And then you have the other extreme. Places bemoaned for the high cost of living are mostly situated in California, with Sunnyvale, CA grabbing the top spot with an average of $2,600/month. San Jose sits closely behind, featuring rents around the $2,300/month mark.

City Avg. Rent City Avg. Rent
Gadsden, AL $400 Sunnyvale, CA $2,600
Johnstown, PA $430 San Jose, CA $2,400
Decatur, IL $495 Cambridge, MA $2,300
Rocky Mount, NC $500 San Francisco, CA $2,000
Joplin, MO $500 Hayward, CA $2,000
Hickory, NC $500 Napa, CA $1,900
Youngstown, OH $500 Huntington Beach, CA $1,900
Monroe, LA $500 Ventura, CA $1,800
Lima, OH $500 Pasadena, CA $1,800
Decatur, AL $500 Rancho Cucamonga, CA $1,800

Only one of the top 10 places with the highest rent in the country is not in California. Surprisingly enough, it’s not New York City, but rather a little college town in Massachusetts we call Cambridge. Rent in the city that’s home to Harvard and MIT is the third highest in the country, averaging $2,200 per month.

Moving far away?

Do it cheaper.

HireAHelper.com can save you up to 40%, compared to traditional interstate van lines.

Compare our long distance moving company options.

$992 a Month: The Typical Mortgage Repayment in the United States

How much is a typical monthly mortgage repayment? Excluding utilities like electricity, water, heating, the national average of a U.S mortgage is around $992/month. 

But it’s not that simple of a figure. Needless to say, buying a home requires putting a substantial amount of money towards the down payment, and fulfilling a set of financial requirements more stringent than those usually applied to prospective renters.


“Only one of the top 10 places with the highest rent in the country is not in California.”


Whether due to these factors, declining mortgage interest rates, or even the impact of COVID on the real estate market, mortgage repayments tend to come in lower than rents.

Being somewhat proportional to the home values, mortgage repayments are usually highest in cities, where homes cost more. However, since we decided to look at actual mortgage payments rather than estimating these figures from home prices alone, our results look somewhat different than you might expect.

The two cities with the highest mortgage repayments are in or near the capital of the U.S.: Alexandria, VA ($2,367) and Washington, D.C. ($2,077).

The rest of the top 10 is mostly made up of cities in the San Francisco Bay Area, with exceptions being Seattle, WA, Stamford, CT, and another satellite location Washington, D.C., Arlington, VA, where a typical mortgage repayment is $1,863.

City Avg. Mortgage Repayment City Avg. Mortgage Repayment
Flint, MI $223 Alexandria, VA $2,367
Detroit, MI $283 Washington, D.C. $2,077
Johnstown, PA $369 San Jose, CA $2,064
Charleston, WV $396 Seattle, WA $2,035
Brownsville, TX $398 Sunnyvale, CA $2,024
Homosassa Springs, FL $413 San Francisco, CA $1,985
Gadsden, AL $420 Stamford, CT $1,978
Edinburg, TX $431 Hayward, CA $1,971
Youngstown, OH $436 Arlington, VA $1,863
Bangor, ME $453 Oakland, CA $1,844

Cities where home prices and mortgage payments are lowest are mostly situated in the Midwest or the South of the country, including cities like Flint and Detroit, both in Michigan, and Brownsville and Edinburg, both in Texas. 

Rent or Buy: How Rent and Mortgage Payments in Each City Compare

Now that we’ve established how much renters and homeowners pay in different parts of the country, let’s look at how rent and mortgage payments compare in each city. Where do renters outspend homeowners and which cities are typical mortgage payments higher than rents?

Based on our analysis, typical rent is higher than a typical mortgage payment in more than half of the cities we looked at (56%, or 187 out of 335 cities analyzed), with the average rent being about 6% higher than the average mortgage payment.  

Compared to homeowners, renters pay the most in cities in Michigan and Florida. In Flint and Detroit, renters pay more than twice as much in rent as typical homeowners pay in their mortgage payments.

Rent in cities like Homosassa Springs, FL and Sarasota, FL tends to be about 1.6 times higher than a typical mortgage payment in the same city.

City Avg. Rent Avg. Mortgage Payment % difference
Flint, MI $535 $223 +140%
Detroit, MI $650 $283 +130%
Flagstaff, AZ $1,100 $620 +77%
Homosassa Springs, FL $700 $413 +69%
Allentown, PA $930 $567 +64%
Sterling Heights, MI $1,100 $677 +163%
Sarasota, FL $1,200 $744 +61%
Bangor, ME $730 $453 +61%
Punta Gorda, FL $900 $575 +57%
Cape Coral, FL $1,100 $720 +53%

Conversely, here are the cities, where payments on mortgages are higher than rents. Top among them is Stamford, CT, where homeowners pay almost a third (30%) more than renters!

In cities like Chicago, IL and Little Rock, AR rent is around 20% lower than a typical monthly payment on a mortgage. Two of the cities where homeowners pay more than renters are in the political capital of the U.S.: Washington, D.C. and Alexandria, VA.

City Avg. Rent Avg. Mortgage Payment % difference
Stamford, CT $1,400 $1,978 -29%
Alexandria, VA $1,800 $2,367 -24%
Sioux Falls, SD $760 $988 -23%
Auburn, AL $670 $851 -21%
Chicago, IL $1,000 $1,263 -21%
Little Rock, AR $700 $870 -20%
Fayetteville, AR $700 $867 -19%
Newark, NJ $1,000 $1,231 -19%
Yuba City, CA $880 $1,080 -19%
Washington, DC $1,700 $2,077 -18%


Wondering what the average rent is like where you live? Want to find a typical mortgage repayment in a city you’re interested in? 

See the full results of our study, check the interactive table below, where you can see how much people in the 335 cities we profiled pay in rent, mortgage payment, and how the two compare.


More Than Just a Mortgage: The True Cost of Home Ownership

So, which is ultimately cheaper: renting or owning a home?

If you were to take mortgage repayments as we listed above and simply compared that to rental prices, you’d notice that a lot of the time, they’re not super different. On average, across the 335 cities we profiled, rents are only 6% higher than mortgage repayments. And in almost half the cities (44%), rents are lower than typical mortgage repayments.


“Homeowners make about twice as much as renters, roughly $98,700 a year before taxes, as compared to an average income of $51,700 a year before taxes for renters.”


However, as most homeowners might tell you, your mortgage might be the biggest cost… but it is only one part of all the expenses that go towards owning and maintaining a home. And they would be 100% right.

According to the figures from the U.S. government census’ American Community Survey, insurance, real estate tax, and utilities contribute an average of $563 to living costs every month. With all this considered, a truer average cost of owning a home in the U.S. is around $1,556 a month.

You can argue that renters pay utilities out of pocket too. But even if we add those up, the average amount renters pay every month rises by $185 to $1,143 a month, which is still some 26% lower than homeowners fork out each month.

A Tale of Two Incomes: Honestly Measuring Housing Affordability in the U.S.

renting vs buyingLooking at the figures so far, owning a home does appear to be more expensive than renting, and not just in up-front investment, but on an ongoing basis, too. 

With the average utility bill, taxes, and other typical costs included, the average cost of homeowning in the U.S. is about $1,556 a month, while renting is $1,143 a month.

True as that may be in nominal terms, there’s one critical aspect to consider in deciding which is more affordable: household income

Even without looking at the data, you can easily imagine that the income of renter households is likely lower than those of homeowners. Renters tend to be younger, earlier in their careers, more likely to be single, etc. 

But the real kicker is just how much lower the income of those who rent tends to be. Homeowners make about twice as much as renters, roughly $98,700 a year before taxes, as compared to an average income of $51,700 a year before taxes for renters.


“…a typical homeowner spends only about 20% of their income on housing costs. For renters, that estimate is 32%!”


When you consider this fact, the $400 “premium” homeowners pay in housing costs doesn’t seem that large. In fact, when you account for taxes and average the income out by month, a typical homeowner spends only about 20% of their income on housing costs. For renters, that estimate is 32%!

That means renters spend over almost one-third of their estimated take-home pay to cover their accommodation costs, despite the oft-repeated personal finance mantra of spending “no more than 30%” on your total living costs.

It’s worth noting that among the 335 cities we profiled, only in two of them is renting more affordable than owning a home: Jersey City, NJ and San Francisco, CA. And in both cases, the difference between what renters spend is merely about 1% under what homeowners spend.

Most and Least Affordable Cities To Rent, Based on Average Income

Now, instead of looking at rent levels and mortgage repayments in isolation, let’s consider affordability as a relative measure. If we express housing costs of renters and homeowners as a percentage of their incomes, which cities would be most and least affordable?

The cities with the most affordable rent with regards to people’s income are in the Midwestern states of Missouri, Wisconsin, and Ohio, with the most affordable being Jefferson City, MO. In most of the top 10, the rent and housing costs are under the recommended 30% of disposable household income.

City Rent as % of income City Rent as % of income
Jefferson City, MO 26.7% Waterbury, CT 62.3%
Sheboygan, WI 27.5% Antioch, CA 59.8%
Eau Claire, WI 27.5% Moreno Valley, CA 57.8%
Wenatchee, WA 28.6% Iowa City, IA 56.5%
Houma, LA 29.0% Newark, NJ 55.6%
St. Joseph, MO 29.4% New Haven, CT 54.6%
Mansfield, OH 29.4% Flint, MI 54.2%
Sioux Falls, SD 29.5% Allentown, PA 53.6%
Lima, OH 29.9% Jackson, MI 53.1%
Wausau, WI 30.4% Bridgeport, CT 51.5%

And the least affordable cities for renters aren’t what you may think. Sure, some of them are in California and more specifically in the Bay Area. For example, costs for renters in Antioch, CA average almost 60% of their estimated disposable income. 

However, among cities with unaffordable rent levels are cities not exactly known for their affluence, like Newark, NJ and Flint, MI, where housing costs for renters are over 55% of their household income.

Most and Least Affordable Cities To Buy, Based on Average Income

Turning back to homeownership, it seems to be most affordable in cities like Huntsville, AL, Decatur, IL, and Houma, LA, where housing costs account for less than 20% of the household income.

Among the least affordable cities for homeownership are Bridgeport, CT, Paterson, NJ, Miami, FL, and Los Angeles, CA. Homeowners in these four cities spend more than 36% of their disposable income on their homes.

City Ownership as % of income City Ownership as % of income
Huntsville, AL 19.6% Bridgeport, CT 36.9%
Decatur, IL 19.7% Paterson, NJ 36.3%
Houma, LA 19.7% Miami, FL 36.2%
Decatur, AL 19.8% Los Angeles, CA 36.1%
Parkersburg, WV 19.8% Salinas, CA 35.3%
Odessa, TX 19.9% Newark, NJ 35.0%
Jefferson City, MO 20.1% Glendale, CA 34.7%
Michigan City, IN 20.3% Providence, RI 33.7%
Green Bay, WI 20.3% Pomona, CA 32.9%
Grand Rapids, MI 20.3% San Diego, CA 32.8%

Curiously enough, Newark, NJ is among the least affordable cities for homeowners as well as for renters. The percentage of their income homeowners in this city spend on their home is 6th highest in the country—35%. As the city with a reasonable commute to New York City is undergoing gentrification, the incomes of local residents might be struggling to keep up.


Housing affordability is a tricky concept. While mortgage repayments alone are lower than rents, it’s worth considering all the extra costs associated with homeownership that don’t factor into rentals. That said, if your income allows you to buy a home, chances are you’ll be spending less of it on your housing.

We’re not in the position to give financial advice, but if you’re considering moving to a place looking for greater affordability, you should consider spending less on your move before you even settle in. 

Sources and Methodology
Unless otherwise stated, all the data used in this study came from the American Community Survey, a government survey that reaches tens of thousands of households in America every year. The latest available data covers the year 2019, and the results were released in January 2021.
Household income was taken separately for owner-occupied and renter-occupied households. Housing costs on top of mortgage/rent include utilities such as heating, electricity, and water. For homeowners, they also include insurance, homeowner association fees, and real estate taxes.
To estimate monthly disposable household income, 70% of the nominal household income was taken using an estimate that an average American pays ≈30% of their income in taxes, then divided by 12.
Illustrations by Meredith Miotke

What’s it Like to Pack Up the President?

Author:

Publish Date:

Last Modified Date:

Category: Mover Stories, Moving Stories

Tags: Tags: , , , , , , , , , , , , , ,

January may be slow for many of us, but for one company things could hardly get any more hectic – particularly on January 20th every four to eight years.

CNN reports that while Trump is down in front of the capitol building taking the oath of office, a team of around one hundred movers were at the White house, involved in a sort of “organized chaos”: six hours to move all the Obamas’ belongings out and, from the other side of the circular driveway, hauling in all the belongings of whoever from Trump’s family is moving in.

(more…)

×

I'm Moving

Moving? Thinking about moving? Whether your move is off in the distance or you already have one foot out the door, you'll learn about everything you should expect through our useful how-to's, cool articles and much more. It's all specially curated for you in our "I'm Moving" section.
Explore
×

I'm a Mover

For rookies or veterans alike, our "I'm a Mover" section is filled with extensive industry news, crucial protips and in-depth guides written by industry professionals. Sharing our decade of moving knowledge is just one way we help keep our professional movers at the top of their game.
Explore